

FET slides as downward price move accelerates under seller momentum

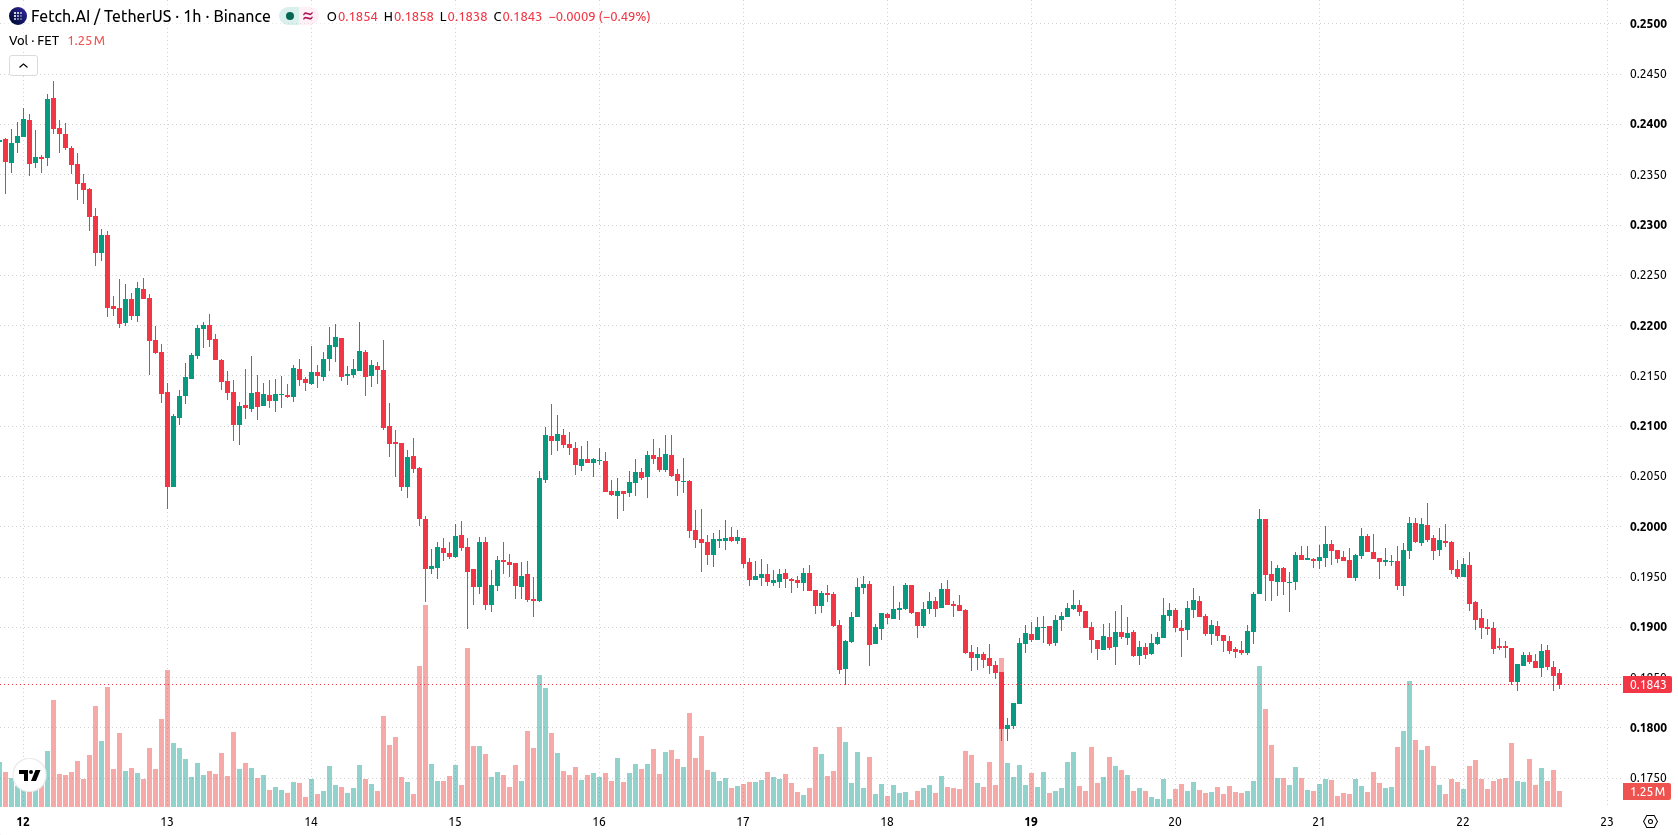
Fetch.ai (FET) is trading at $0.1842, down 7.58% on the day. The price sits below its key moving averages, reflecting strong seller momentum during a volatile session.
 0.1615
0.1857
Highlights
- Fetch.ai trades below key short-term, medium-term, and long-term moving averages, indicating persistent seller pressure across all timeframes.
- Bearish technical signals dominate, with strong negative trend readings and key resistance at $0.193 reinforcing downside momentum.
- Price is down 7.58% at $0.1842, expected to remain in the $0.1774 to $0.191 range unless support or resistance is broken.
Downside momentum confirmed as multiple technical barriers align
On the technical front, FET trades below its MA-20 ($0.19) and MA-50 ($0.1942) on the hourly chart, as well as the MA-200 ($0.1903) on the daily timeframe. The Ichimoku Kijun level at $0.193 acts as immediate resistance for the session. Momentum indicators confirm seller control, with MACD, ADX, RSI at 34.47, CCI, and Bull/Bear Power all signaling downside. Meanwhile, Stochastic RSI and the Awesome Oscillator both remain neutral, offering no countertrend signals.
Rangebound outlook persists as risk of breakdown stays elevated
In the short term, FET/USD is expected to move within a $0.1774–$0.191 volatility band relative to current levels. The baseline scenario is a rangebound session capped by support at $0.1774 and resistance at $0.193. Should price break above $0.193, a recovery could develop, but the likelihood of further downside remains elevated if support fails.
Earlier, analysts noted that Fetch.ai faced persistent selling pressure and a pronounced bearish outlook. The current technical setup reinforces this view, with traders advised to monitor the $0.1774 support as a pivotal level for any potential shift in price direction.










-
 Afghanistan
-
 Albania
-
 Algeria
-
 Angola
-
 Argentina
-
 Armenia
-
 Australia
-
 Austria
-
 Azerbaijan
-
 Bahamas
-
 Bahrain
-
 Bangladesh
-
 Belarus
-
 Belgium
-
 Bolivia
-
 Botswana
-
 Brazil
-
 Brunei
-
 Bulgaria
-
 Cambodia
-
 Cameroon
-
 Canada
-
 Chile
-
 China
-
 Colombia
-
 Congo
-
 Costa Rica
-
 Cote d'Ivoire
-
 Croatia
-
 Cuba
-
 Cyprus
-
 Czechia
-
 DR Congo
-
 Denmark
-
 Dominican Republic
-
 Ecuador
-
 Egypt
-
 El Salvador
-
 Estonia
-
 Eswatini
-
 Ethiopia
-
 Finland
-
 France
-
 Georgia
-
 Germany
-
 Ghana
-
 Greece
-
 Haiti
-
 Hong Kong
-
 Hungary
-
 India
-
 Indonesia
-
 Iran, Islamic republic
-
 Iraq
-
 Ireland
-
 Israel
-
 Italy
-
 Jamaica
-
 Japan
-
 Jordan
-
 Kazakhstan
-
 Kenya
-
 Korea
-
 Kuwait
-
 Kyrgyzstan
-
 Laos
-
 Latvia
-
 Lebanon
-
 Lesotho
-
 Libya
-
 Lithuania
-
 Luxembourg
-
 Madagascar
-
 Malaysia
-
 Malta
-
 Mauritius
-
 Mexico
-
 Moldova
-
 Mongolia
-
 Montenegro
-
 Morocco
-
 Mozambique
-
 Myanmar
-
 Namibia
-
 Nepal
-
 Netherlands
-
 New Zealand
-
 Nigeria
-
 North Macedonia
-
 Norway
-
 Oman
-
 Pakistan
-
 Palestine
-
 Panama
-
 Papua New Guinea
-
 Paraguay
-
 Peru
-
 Philippines
-
 Poland
-
 Portugal
-
 Puerto Rico
-
 Qatar
-
 Reunion
-
 Romania
-
 Rwanda
-
 Saudi Arabia
-
 Serbia
-
 Singapore
-
 Slovakia
-
 Slovenia
-
 Somalia
-
 South Africa
-
 Spain
-
 Sri Lanka
-
 Sweden
-
 Switzerland
-
 Syria
-
 Taiwan
-
 Tajikistan
-
 Tanzania
-
 Thailand
-
 Trinidad and Tobago
-
 Tunisia
-
 Turkey
-
 UAE
-
 Uganda
-
 Ukraine
-
 United Kingdom
-
United States
-
 Uruguay
-
 Uzbekistan
-
 Venezuela
-
 Vietnam
-
 Yemen
-
 Zambia
-
 Zimbabwe
- Forex
- Crypto












