

What's behind Curve's latest 10.5% price pullback?

Curve (CRV) tumbled 10.47% as a contraction in futures open interest and increased taker selling triggered heavy intraday downside. The decline is supported by clear selling pressure and elevated volatility, although nearby support levels are being watched for a possible short-term floor.
 0.2605
0.2822
Highlights
- Curve DAO Token open interest contracted and taker selling surged from October 21 to October 22, 2026.
- CRV experienced shifts in governance and liquidity operations during a broader downturn in the crypto market.
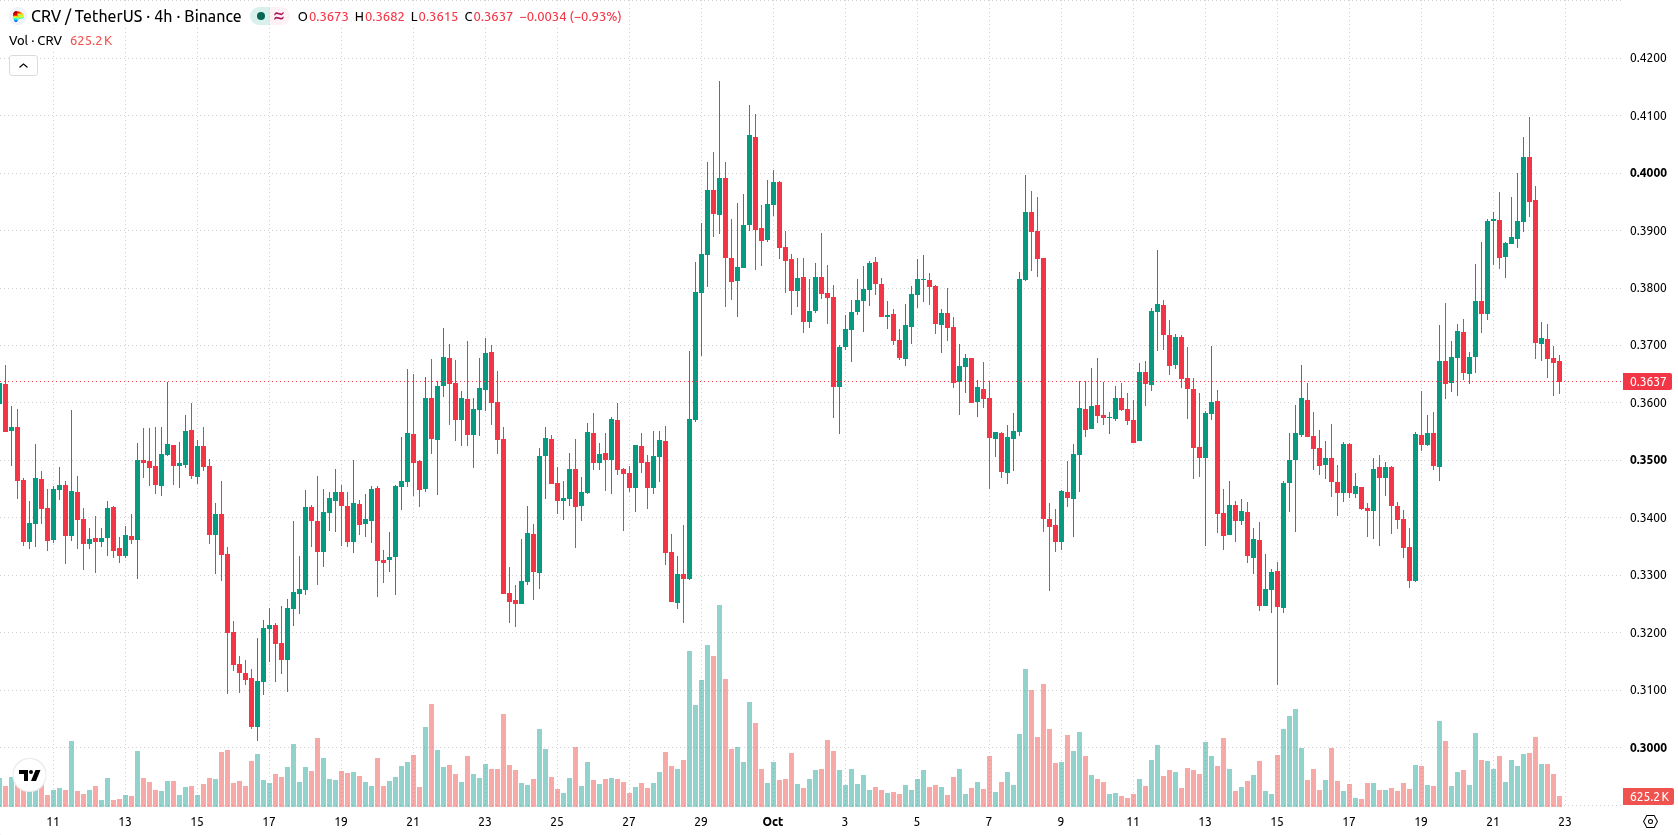
- CRV/USD trades near $0.3634 after a 10.47% drop, with mixed short-term momentum signals and a five-day range expected between $0.3241 to $0.4261.
Liquidity shifts and governance changes amid broad market retreat
Curve DAO Token was affected by a contraction in futures open interest and a surge in taker selling between October 21 and October 22, 2026. During this period, CRV also recorded changing dynamics in its governance and liquidity functions on the Curve Finance protocol. These developments unfolded during a broader crypto market downturn.
Bullish momentum challenged by overbought signals and boundary tests
CRV/USD is trading above the MA-20 ($0.3625), MA-50 ($0.3575), and MA-200 ($0.2628), signaling bullish momentum across short-, medium-, and long-term trends. Immediate reference levels are the near-term floor at $0.3625 and the near-term ceiling at $0.4062, with the Ichimoku Kijun ($0.3634) acting as support. Momentum is firm, with MACD and RSI both in buy territory, although the ADX reads neutral, hinting at moderate trend strength. Both CCI and Stochastic RSI indicate overbought conditions. BBP shows buyers currently dominate intraday momentum, though overbought signals suggest risk of a near-term pullback. The Awesome Oscillator also supports ongoing bullish sentiment. The pair is quoted at $0.3634, down $0.0425 or 10.47% for the day, after opening with a downside gap of around 0.79%. Price sits near the day’s low, daily volatility is elevated at 13.40%, and intraday tone suggests pressure after the open. Short-term signals are mixed, as momentum is strong yet overbought readings warrant caution.
Earlier, analysts noted that Curve was experiencing persistent selling pressure and heightened volatility, with risks skewed to the downside. The latest technical data signals a shift toward bullish momentum, but with overbought readings and elevated volatility, traders should closely monitor the $0.3241 support as a potential inflection point for short-term trend reversals.








-
 Afghanistan
-
 Albania
-
 Algeria
-
 Angola
-
 Argentina
-
 Armenia
-
 Australia
-
 Austria
-
 Azerbaijan
-
 Bahamas
-
 Bahrain
-
 Bangladesh
-
 Belarus
-
 Belgium
-
 Bolivia
-
 Botswana
-
 Brazil
-
 Brunei
-
 Bulgaria
-
 Cambodia
-
 Cameroon
-
 Canada
-
 Chile
-
 China
-
 Colombia
-
 Congo
-
 Costa Rica
-
 Cote d'Ivoire
-
 Croatia
-
 Cuba
-
 Cyprus
-
 Czechia
-
 DR Congo
-
 Denmark
-
 Dominican Republic
-
 Ecuador
-
 Egypt
-
 El Salvador
-
 Estonia
-
 Eswatini
-
 Ethiopia
-
 Finland
-
 France
-
 Georgia
-
 Germany
-
 Ghana
-
 Greece
-
 Haiti
-
 Hong Kong
-
 Hungary
-
 India
-
 Indonesia
-
 Iran, Islamic republic
-
 Iraq
-
 Ireland
-
 Israel
-
 Italy
-
 Jamaica
-
 Japan
-
 Jordan
-
 Kazakhstan
-
 Kenya
-
 Korea
-
 Kuwait
-
 Kyrgyzstan
-
 Laos
-
 Latvia
-
 Lebanon
-
 Lesotho
-
 Libya
-
 Lithuania
-
 Luxembourg
-
 Madagascar
-
 Malaysia
-
 Malta
-
 Mauritius
-
 Mexico
-
 Moldova
-
 Mongolia
-
 Montenegro
-
 Morocco
-
 Mozambique
-
 Myanmar
-
 Namibia
-
 Nepal
-
 Netherlands
-
 New Zealand
-
 Nigeria
-
 North Macedonia
-
 Norway
-
 Oman
-
 Pakistan
-
 Palestine
-
 Panama
-
 Papua New Guinea
-
 Paraguay
-
 Peru
-
 Philippines
-
 Poland
-
 Portugal
-
 Puerto Rico
-
 Qatar
-
 Reunion
-
 Romania
-
 Rwanda
-
 Saudi Arabia
-
 Serbia
-
 Singapore
-
 Slovakia
-
 Slovenia
-
 Somalia
-
 South Africa
-
 Spain
-
 Sri Lanka
-
 Sweden
-
 Switzerland
-
 Syria
-
 Taiwan
-
 Tajikistan
-
 Tanzania
-
 Thailand
-
 Trinidad and Tobago
-
 Tunisia
-
 Turkey
-
 UAE
-
 Uganda
-
 Ukraine
-
 United Kingdom
-
United States
-
 Uruguay
-
 Uzbekistan
-
 Venezuela
-
 Vietnam
-
 Yemen
-
 Zambia
-
 Zimbabwe
- Forex
- Crypto












