

Polkadot falls amid dominant seller activity and downward price move

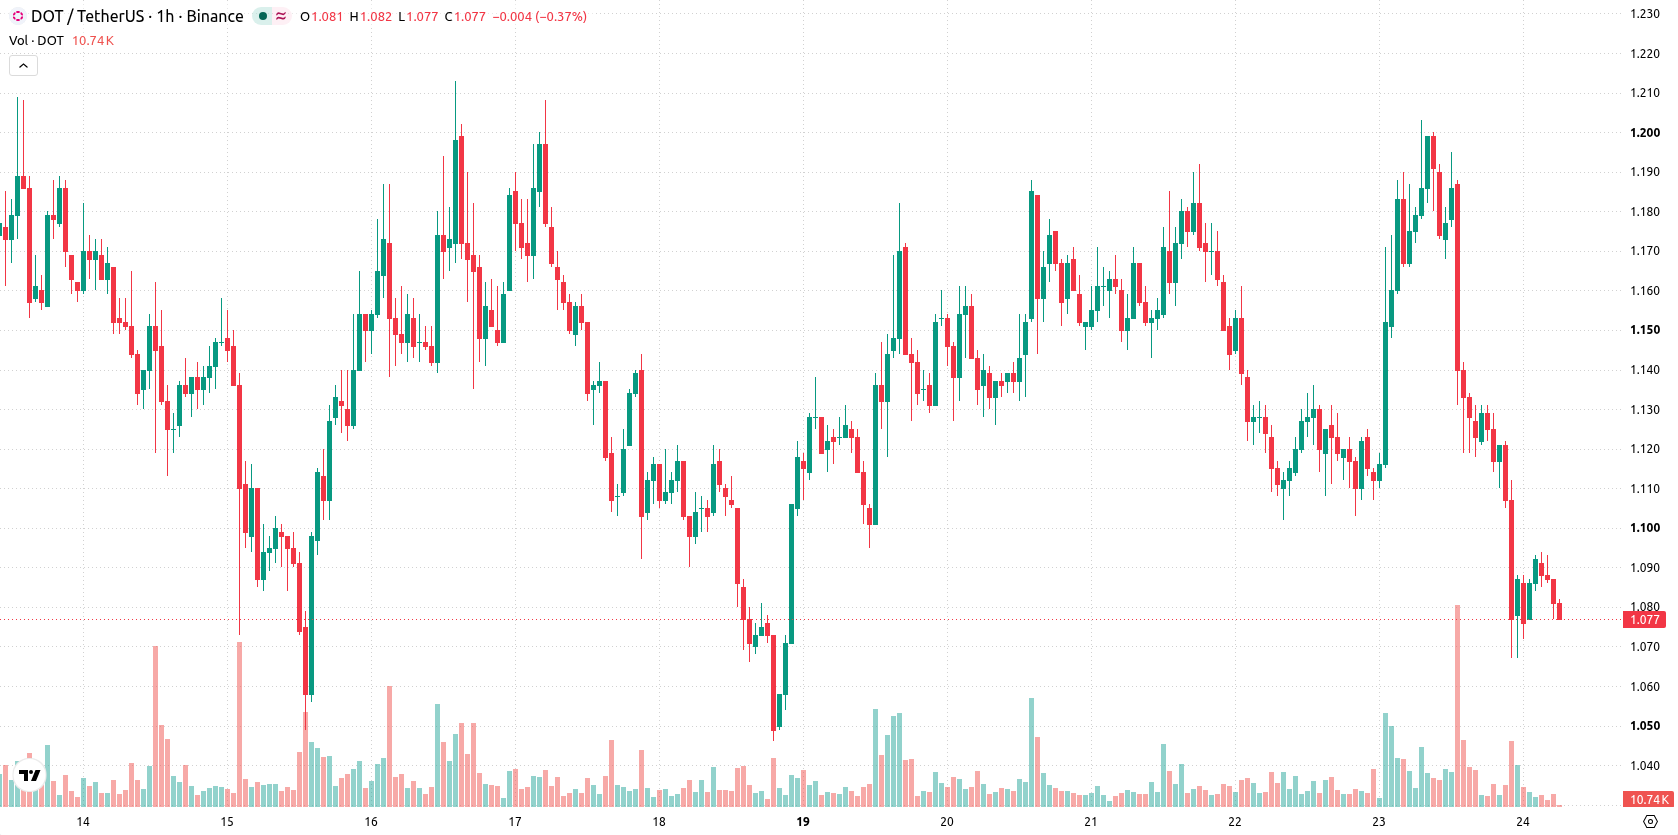
Polkadot (DOT) is trading at $1.081, down 8% on the day. The asset is currently positioned below its key short- and medium-term moving averages, but staying above long-term average levels.
 0.656
0.747
Highlights
- Polkadot enacted a tokenomics shift in March 2026, reducing annual issuance to 55 million DOT and capping total supply at 2.1 billion.
- As of October 23, 2026, DOT held a market capitalization of about $2.03 billion with extremely consolidated token distribution across network hubs.
- DOT/USD faces persistent selling pressure with bearish momentum indicators, an expected price range of $0.998 to $1.116, and low probability of recovery in the short term.
Tokenomics overhaul and tight token holding as price stays pressured
Polkadot implemented a significant change to its tokenomics in March 2026 by reducing its annual issuance to 55 million DOT and establishing a supply cap of 2.1 billion tokens, a move that reduces future inflation and could support long-term value through increased scarcity. On October 23, 2026, DOT's market capitalization stood at approximately $2.03 billion, ranking 53rd among cryptocurrencies, according to Tokenpost, providing context for its scale in the sector. Additionally, network data from Cryptoticker showed that 99.986% of all tokens were held across the relay chain and Asset Hub on the same date, reflecting a highly consolidated token distribution and potentially influencing the liquidity environment, though price action has remained under broader selling pressure.
Bearish momentum prevails as key technical resistance holds
DOT/USD is currently trading below both the MA-20 and MA-50 on the hourly chart, while remaining above the MA-200 on the daily timeframe. The Ichimoku Kijun sits at $1.135, serving as immediate resistance. Momentum indicators, including MACD and ADX, are in bearish territory, as are RSI and CCI, which both reflect continued seller control without oversold signals. Stoch RSI is neutral, and Bull/Bear Power points to dominance by sellers on an intraday basis, while the Awesome Oscillator provides no strong trend confirmation.
Further declines likely as breakout risk remains limited
Over the next 2–3 trading days, DOT is expected to move within a typical volatility range of $0.998 to $1.116. The probability of an upward move remains very low, with further price declines more likely. The baseline scenario calls for sideways movement in the stated range, while a close above $1.135 could indicate renewed buying interest; a breakdown below $0.998 may trigger heavier selling.
Earlier, analysts noted that Polkadot was experiencing accelerated bullish momentum above key moving averages despite recent security concerns. The current analysis marks a clear shift, with DOT trading below short- and medium-term averages and underscoring the near-term downside risk, making a sustained move above $1.135 the level to monitor for any possible reversal.






Latest Polkadot News




-
 Afghanistan
-
 Albania
-
 Algeria
-
 Angola
-
 Argentina
-
 Armenia
-
 Australia
-
 Austria
-
 Azerbaijan
-
 Bahamas
-
 Bahrain
-
 Bangladesh
-
 Belarus
-
 Belgium
-
 Bolivia
-
 Botswana
-
 Brazil
-
 Brunei
-
 Bulgaria
-
 Cambodia
-
 Cameroon
-
 Canada
-
 Chile
-
 China
-
 Colombia
-
 Congo
-
 Costa Rica
-
 Cote d'Ivoire
-
 Croatia
-
 Cuba
-
 Cyprus
-
 Czechia
-
 DR Congo
-
 Denmark
-
 Dominican Republic
-
 Ecuador
-
 Egypt
-
 El Salvador
-
 Estonia
-
 Eswatini
-
 Ethiopia
-
 Finland
-
 France
-
 Georgia
-
 Germany
-
 Ghana
-
 Greece
-
 Haiti
-
 Hong Kong
-
 Hungary
-
 India
-
 Indonesia
-
 Iran, Islamic republic
-
 Iraq
-
 Ireland
-
 Israel
-
 Italy
-
 Jamaica
-
 Japan
-
 Jordan
-
 Kazakhstan
-
 Kenya
-
 Korea
-
 Kuwait
-
 Kyrgyzstan
-
 Laos
-
 Latvia
-
 Lebanon
-
 Lesotho
-
 Libya
-
 Lithuania
-
 Luxembourg
-
 Madagascar
-
 Malaysia
-
 Malta
-
 Mauritius
-
 Mexico
-
 Moldova
-
 Mongolia
-
 Montenegro
-
 Morocco
-
 Mozambique
-
 Myanmar
-
 Namibia
-
 Nepal
-
 Netherlands
-
 New Zealand
-
 Nigeria
-
 North Macedonia
-
 Norway
-
 Oman
-
 Pakistan
-
 Palestine
-
 Panama
-
 Papua New Guinea
-
 Paraguay
-
 Peru
-
 Philippines
-
 Poland
-
 Portugal
-
 Puerto Rico
-
 Qatar
-
 Reunion
-
 Romania
-
 Rwanda
-
 Saudi Arabia
-
 Serbia
-
 Singapore
-
 Slovakia
-
 Slovenia
-
 Somalia
-
 South Africa
-
 Spain
-
 Sri Lanka
-
 Sweden
-
 Switzerland
-
 Syria
-
 Taiwan
-
 Tajikistan
-
 Tanzania
-
 Thailand
-
 Trinidad and Tobago
-
 Tunisia
-
 Turkey
-
 UAE
-
 Uganda
-
 Ukraine
-
 United Kingdom
-
United States
-
 Uruguay
-
 Uzbekistan
-
 Venezuela
-
 Vietnam
-
 Yemen
-
 Zambia
-
 Zimbabwe
- Forex
- Crypto












