

What's behind Cosmos's latest 9.2% price pullback?

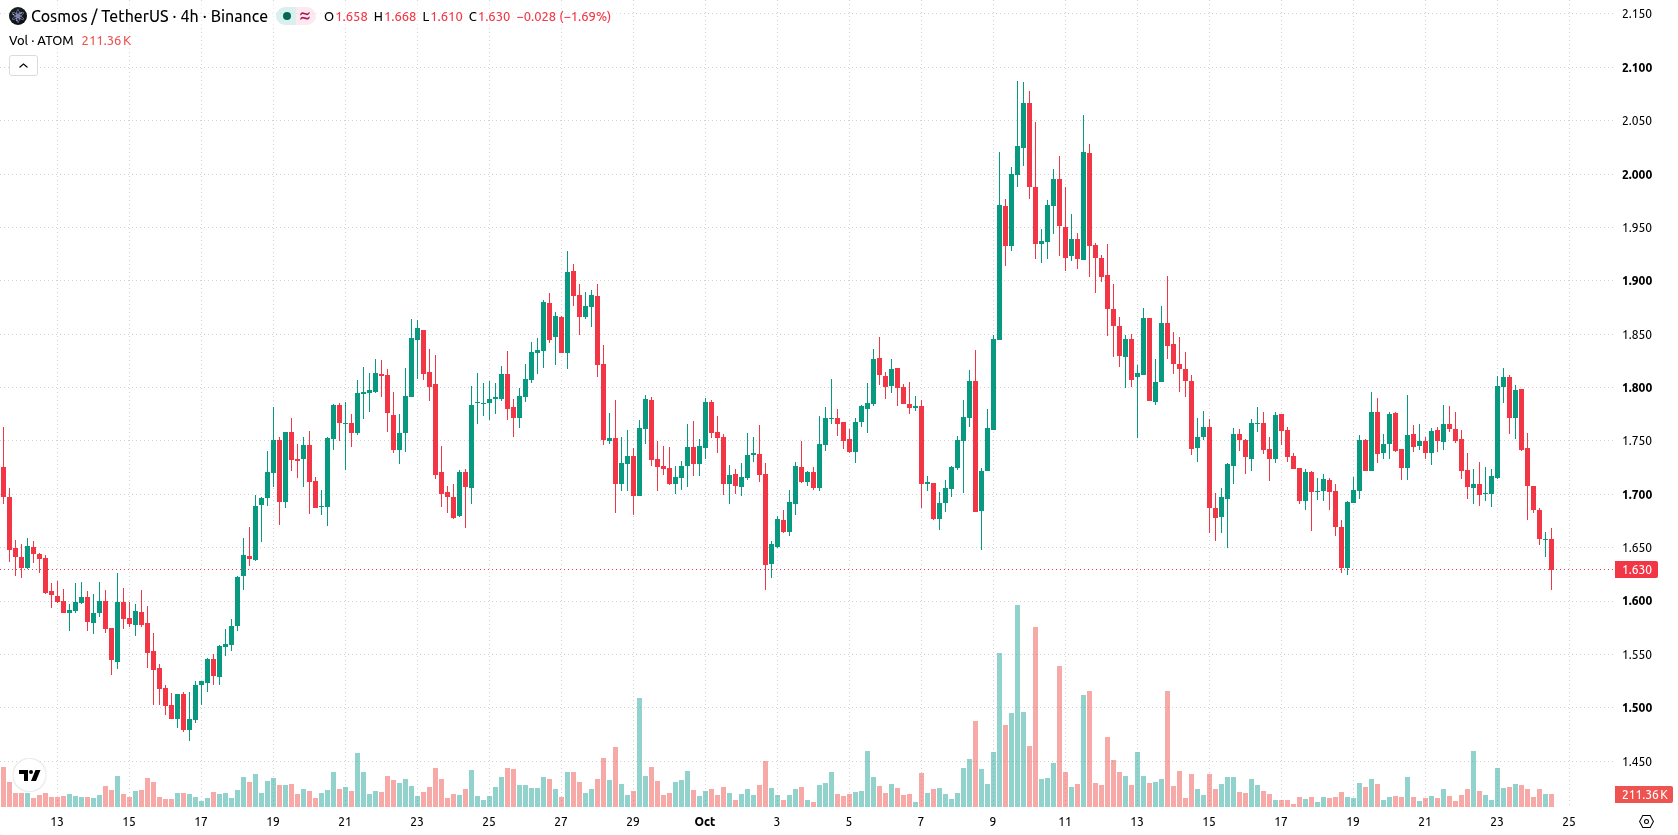
Cosmos (ATOM) slumped 9.2% after sellers maintained short-, medium-, and long-term pressure, even as recent action showed short-term resilience relative to the broader market. The scale of the decline is reinforced by the token trading below its key moving averages, indicating that technical weakness continues to dominate the session.
 1.267
1.4440000
Highlights
- Cosmos operates independently on its own blockchain with no new regulatory actions, product releases, or protocol changes reported.
- The absence of recent fundamental developments leaves the network's standing unchanged over the latest period.
- ATOM/USD trades below key moving averages with mixed technical signals, a daily low of $1.628, and an expected range of $1.531 to $1.725 over five sessions.
Lack of new developments curtails Cosmos-specific sentiment and news-driven flows
Cosmos operates on its own blockchain network. No recent developments regarding regulatory actions, product launches, or protocol upgrades directly connected to Cosmos were confirmed in the latest news.
Technical weakness persists as mixed momentum signals and resistance cap recovery
ATOM/USD is trading below the 20-day, 50-day, and 200-day moving averages ($1.7906, $1.73658, and $1.710605), signaling ongoing short-, medium-, and long-term pressure from sellers. The nearest resistance is the near-term ceiling at $1.641, with the near-term floor at $1.624. The distant alignment of the 50-day and 200-day averages remains bullish, but does not offset the prevailing short-term weakness. Momentum signals are mixed. MACD and ADX both point to neutral momentum, while the RSI is moderately weak at 49.3 with a sell forecast. The CCI is neutral, and the Stochastic RSI shows a strong buy signal from an oversold area. Bull/Bear Power (BBP) is positive at 0.0603724, indicating that buyers dominate intraday momentum, and the Hull Moving Average (HMA) also echoes a strong buy. Despite these pockets of buyer interest, intraday trading has seen the price drop to $1.628, declining $0.165 or 9.2% on the day after a downside gap of about 4.8%. ATOM/USD is trading near the low of its daily range, with daily volatility at 4.02%. The day’s tone is negative, with persistent pressure after the open, and some divergence among oscillators highlights uncertain direction.
Earlier, analysts noted that Cosmos was stuck in a consolidating downtrend, with persistent selling pressure and mixed technical signals limiting prospects for a reversal. The current analysis confirms ongoing technical weakness, but with the probability of further decline elevated, traders should closely monitor the $1.624 near-term floor for signs of intensified downside risk.











-
 Afghanistan
-
 Albania
-
 Algeria
-
 Angola
-
 Argentina
-
 Armenia
-
 Australia
-
 Austria
-
 Azerbaijan
-
 Bahamas
-
 Bahrain
-
 Bangladesh
-
 Belarus
-
 Belgium
-
 Bolivia
-
 Botswana
-
 Brazil
-
 Brunei
-
 Bulgaria
-
 Cambodia
-
 Cameroon
-
 Canada
-
 Chile
-
 China
-
 Colombia
-
 Congo
-
 Costa Rica
-
 Cote d'Ivoire
-
 Croatia
-
 Cuba
-
 Cyprus
-
 Czechia
-
 DR Congo
-
 Denmark
-
 Dominican Republic
-
 Ecuador
-
 Egypt
-
 El Salvador
-
 Estonia
-
 Eswatini
-
 Ethiopia
-
 Finland
-
 France
-
 Georgia
-
 Germany
-
 Ghana
-
 Greece
-
 Haiti
-
 Hong Kong
-
 Hungary
-
 India
-
 Indonesia
-
 Iran, Islamic republic
-
 Iraq
-
 Ireland
-
 Israel
-
 Italy
-
 Jamaica
-
 Japan
-
 Jordan
-
 Kazakhstan
-
 Kenya
-
 Korea
-
 Kuwait
-
 Kyrgyzstan
-
 Laos
-
 Latvia
-
 Lebanon
-
 Lesotho
-
 Libya
-
 Lithuania
-
 Luxembourg
-
 Madagascar
-
 Malaysia
-
 Malta
-
 Mauritius
-
 Mexico
-
 Moldova
-
 Mongolia
-
 Montenegro
-
 Morocco
-
 Mozambique
-
 Myanmar
-
 Namibia
-
 Nepal
-
 Netherlands
-
 New Zealand
-
 Nigeria
-
 North Macedonia
-
 Norway
-
 Oman
-
 Pakistan
-
 Palestine
-
 Panama
-
 Papua New Guinea
-
 Paraguay
-
 Peru
-
 Philippines
-
 Poland
-
 Portugal
-
 Puerto Rico
-
 Qatar
-
 Reunion
-
 Romania
-
 Rwanda
-
 Saudi Arabia
-
 Serbia
-
 Singapore
-
 Slovakia
-
 Slovenia
-
 Somalia
-
 South Africa
-
 Spain
-
 Sri Lanka
-
 Sweden
-
 Switzerland
-
 Syria
-
 Taiwan
-
 Tajikistan
-
 Tanzania
-
 Thailand
-
 Trinidad and Tobago
-
 Tunisia
-
 Turkey
-
 UAE
-
 Uganda
-
 Ukraine
-
 United Kingdom
-
United States
-
 Uruguay
-
 Uzbekistan
-
 Venezuela
-
 Vietnam
-
 Yemen
-
 Zambia
-
 Zimbabwe
- Forex
- Crypto












