

PYTH rallies as strong upside momentum attracts active buying interest

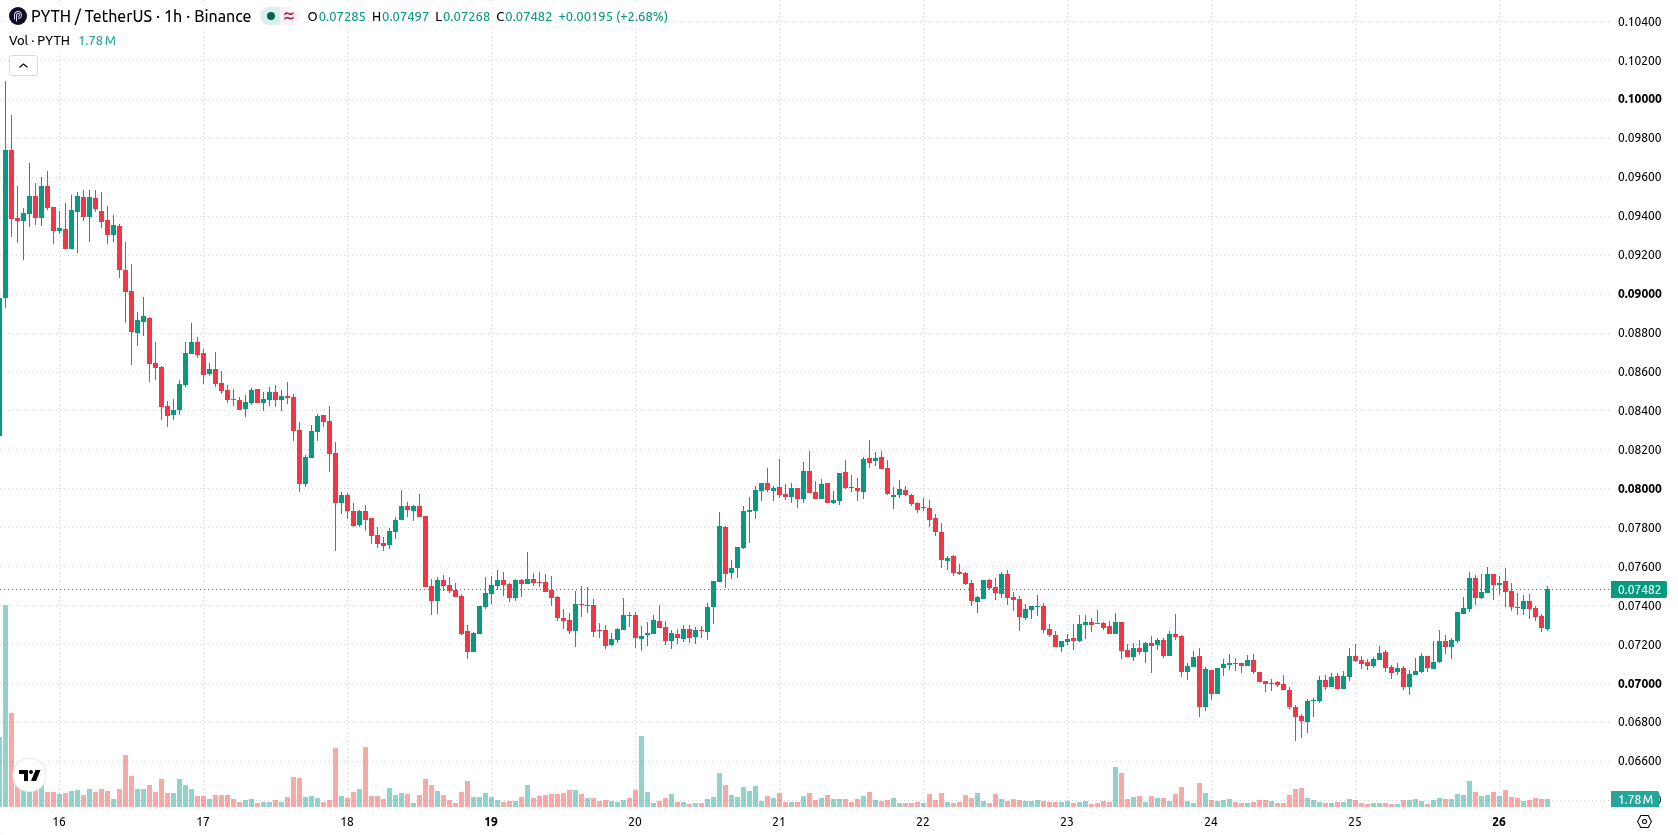
Pyth (PYTH) is trading at $0.0748 after a 7.42% gain on the day, posting strong upward momentum. The price currently sits above its key moving averages, reflecting broad strength versus recent trading trends.
 0.063
0.0762
Highlights
- PYTH/USD maintains bullish momentum above major moving averages on hourly and daily charts, supported by a recent 7.42% rise to $0.0748.
- Momentum indicators are mixed, with trend-based tools showing buying strength but oscillators signaling uncertainty and a potential short-term pause.
- The price is expected to move within a $0.0713 to $0.0783 range over the next 2 to 3 days, with a 52% probability of a minor pullback.
Bullish signals meet seller participation as technicals diverge
On the H1 chart, PYTH is positioned above the MA-20 at $0.0737 and MA-50 at $0.0716, while on the daily timeframe, it remains well above the MA-200 at $0.0504. The Ichimoku Kijun serves as immediate support at $0.0727. Among oscillators and momentum readings, MACD gives a strong buy signal and ADX also points to active buying interest. However, RSI is at a neutral 50.58, with Stoch RSI in oversold territory, suggesting a potential short-term pause. CCI presents a neutral reading, and Bull/Bear Power is on sell, highlighting increased intraday participation from sellers despite the bullish bias in trend indicators.
Sideways consolidation favored as volatility and risks persist
In the short term, PYTH is likely to remain volatile within the $0.0713 to $0.0783 band, consistent with typical price movement over the past days. With a 48% probability of further upside and a marginally greater 52% likelihood of a pullback, the baseline scenario is for sideways consolidation as momentum normalizes. An upside break above $0.0783 could trigger accelerated gains, while a drop below $0.0713 would increase the risk of a deeper retracement.
Earlier, analysts noted that Pyth was regaining bullish momentum following a period of downside pressure, with technical trends pointing to a potential reversal. Current price action adds nuance, as short-term indicators now highlight rising volatility and mixed momentum, with traders advised to watch for a decisive move above $0.0783 or below $0.0713 to gauge the next directional break.











-
 Afghanistan
-
 Albania
-
 Algeria
-
 Angola
-
 Argentina
-
 Armenia
-
 Australia
-
 Austria
-
 Azerbaijan
-
 Bahamas
-
 Bahrain
-
 Bangladesh
-
 Belarus
-
 Belgium
-
 Bolivia
-
 Botswana
-
 Brazil
-
 Brunei
-
 Bulgaria
-
 Cambodia
-
 Cameroon
-
 Canada
-
 Chile
-
 China
-
 Colombia
-
 Congo
-
 Costa Rica
-
 Cote d'Ivoire
-
 Croatia
-
 Cuba
-
 Cyprus
-
 Czechia
-
 DR Congo
-
 Denmark
-
 Dominican Republic
-
 Ecuador
-
 Egypt
-
 El Salvador
-
 Estonia
-
 Eswatini
-
 Ethiopia
-
 Finland
-
 France
-
 Georgia
-
 Germany
-
 Ghana
-
 Greece
-
 Haiti
-
 Hong Kong
-
 Hungary
-
 India
-
 Indonesia
-
 Iran, Islamic republic
-
 Iraq
-
 Ireland
-
 Israel
-
 Italy
-
 Jamaica
-
 Japan
-
 Jordan
-
 Kazakhstan
-
 Kenya
-
 Korea
-
 Kuwait
-
 Kyrgyzstan
-
 Laos
-
 Latvia
-
 Lebanon
-
 Lesotho
-
 Libya
-
 Lithuania
-
 Luxembourg
-
 Madagascar
-
 Malaysia
-
 Malta
-
 Mauritius
-
 Mexico
-
 Moldova
-
 Mongolia
-
 Montenegro
-
 Morocco
-
 Mozambique
-
 Myanmar
-
 Namibia
-
 Nepal
-
 Netherlands
-
 New Zealand
-
 Nigeria
-
 North Macedonia
-
 Norway
-
 Oman
-
 Pakistan
-
 Palestine
-
 Panama
-
 Papua New Guinea
-
 Paraguay
-
 Peru
-
 Philippines
-
 Poland
-
 Portugal
-
 Puerto Rico
-
 Qatar
-
 Reunion
-
 Romania
-
 Rwanda
-
 Saudi Arabia
-
 Serbia
-
 Singapore
-
 Slovakia
-
 Slovenia
-
 Somalia
-
 South Africa
-
 Spain
-
 Sri Lanka
-
 Sweden
-
 Switzerland
-
 Syria
-
 Taiwan
-
 Tajikistan
-
 Tanzania
-
 Thailand
-
 Trinidad and Tobago
-
 Tunisia
-
 Turkey
-
 UAE
-
 Uganda
-
 Ukraine
-
 United Kingdom
-
United States
-
 Uruguay
-
 Uzbekistan
-
 Venezuela
-
 Vietnam
-
 Yemen
-
 Zambia
-
 Zimbabwe
- Forex
- Crypto












