

Ethereum technical analysis: Uptrend eyes resistance at $2,407

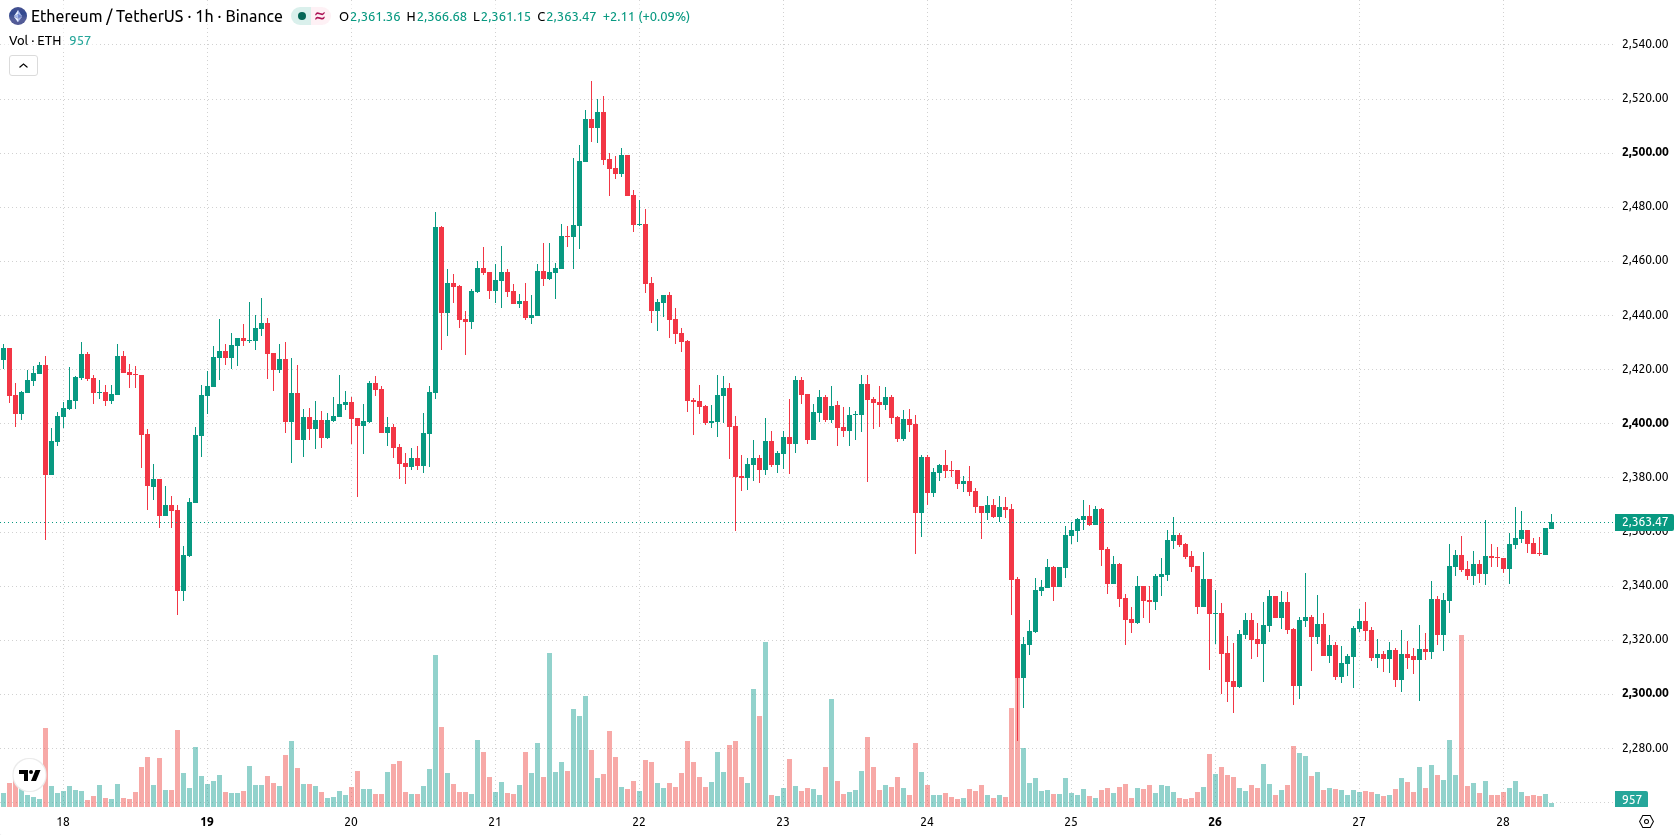
Ethereum (ETH) is trading at $2,362.44 after rising 1.98% over the past day and remains above its key moving averages, reflecting underlying upward momentum.
 1845.18
2160.50
Highlights
- Ethereum activated its ENSv2 protocol upgrade on October 27, 2026, expanding decentralized naming with improved registry and permissions.
- The Ethereum Foundation conducted a routine treasury sale by converting about $6.4 million in ETH to stablecoins, with spot ETFs reporting $88.6 million in net outflows on October 26, 2026.
- ETH/USD trades in a bullish structure across timeframes, with technicals projecting a likely near-term range of $2,276 to $2,407 and upside probability at 70%.
Protocol upgrade and mixed flows fuel cautious sentiment shift
Ethereum's latest protocol upgrade, ENSv2, officially launched on the mainnet on October 27, 2026, bringing a new hierarchical registry and enhanced permission controls that broaden utility for decentralized naming services, according to Kucoin. This expansion of core blockchain functionality is likely drawing increased user and developer engagement, providing a catalyst for positive sentiment. Meanwhile, a routine treasury sale by the Ethereum Foundation, exchanging roughly $6.4 million worth of ETH for stablecoins as reported by Investinglive, underscores ongoing financial management without indicating stress. Additional context comes from spot Ethereum ETFs recording $88.6 million in net outflows on October 26, 2026, and a delay in the Glamsterdam upgrade's Hoodi testnet rollout due to security concerns, adding a mix of tempered sentiment and technical caution to the market backdrop.
Bullish bias strengthened as technicals diverge on short-term signals
Key technical levels show ETH/USD trading above the MA-20 and MA-50 on the hourly timeframe, and remaining well above the MA-200 on the daily chart. The Ichimoku Kijun on the daily timeframe stands at $2,333 and acts as immediate support. On the momentum side, MACD is registering a strong buy signal, and ADX confirms a trend bias to the upside. RSI is at 58.17, indicating a buy condition, while Stoch RSI is currently oversold, suggesting underlying support. CCI is neutral, Bull/Bear Power is overbought, and the Awesome Oscillator remains neutral, pointing to some divergence between trending and oscillator signals.
Range trading expected amid upside probability and key resistance levels
In the short term, ETH/USD is projected to consolidate within a typical volatility band between $2,276 and $2,407. With a 70% probability assessed for further upside, the baseline scenario favors range trading with an upward bias. A break above the upper resistance at $2,407 could trigger further gains, while a drop below $2,276 would mark the start of a bearish scenario.
Earlier, analysts noted that Ethereum faced downside risk due to weak institutional demand and uncertain macroeconomic conditions. The latest technical and fundamental signals point to a potential upside bias within the current consolidation range, with traders advised to monitor for a sustained move above $2,407 to confirm further gains.











-
 Afghanistan
-
 Albania
-
 Algeria
-
 Angola
-
 Argentina
-
 Armenia
-
 Australia
-
 Austria
-
 Azerbaijan
-
 Bahamas
-
 Bahrain
-
 Bangladesh
-
 Belarus
-
 Belgium
-
 Bolivia
-
 Botswana
-
 Brazil
-
 Brunei
-
 Bulgaria
-
 Cambodia
-
 Cameroon
-
 Canada
-
 Chile
-
 China
-
 Colombia
-
 Congo
-
 Costa Rica
-
 Cote d'Ivoire
-
 Croatia
-
 Cuba
-
 Cyprus
-
 Czechia
-
 DR Congo
-
 Denmark
-
 Dominican Republic
-
 Ecuador
-
 Egypt
-
 El Salvador
-
 Estonia
-
 Eswatini
-
 Ethiopia
-
 Finland
-
 France
-
 Georgia
-
 Germany
-
 Ghana
-
 Greece
-
 Haiti
-
 Hong Kong
-
 Hungary
-
 India
-
 Indonesia
-
 Iran, Islamic republic
-
 Iraq
-
 Ireland
-
 Israel
-
 Italy
-
 Jamaica
-
 Japan
-
 Jordan
-
 Kazakhstan
-
 Kenya
-
 Korea
-
 Kuwait
-
 Kyrgyzstan
-
 Laos
-
 Latvia
-
 Lebanon
-
 Lesotho
-
 Libya
-
 Lithuania
-
 Luxembourg
-
 Madagascar
-
 Malaysia
-
 Malta
-
 Mauritius
-
 Mexico
-
 Moldova
-
 Mongolia
-
 Montenegro
-
 Morocco
-
 Mozambique
-
 Myanmar
-
 Namibia
-
 Nepal
-
 Netherlands
-
 New Zealand
-
 Nigeria
-
 North Macedonia
-
 Norway
-
 Oman
-
 Pakistan
-
 Palestine
-
 Panama
-
 Papua New Guinea
-
 Paraguay
-
 Peru
-
 Philippines
-
 Poland
-
 Portugal
-
 Puerto Rico
-
 Qatar
-
 Reunion
-
 Romania
-
 Rwanda
-
 Saudi Arabia
-
 Serbia
-
 Singapore
-
 Slovakia
-
 Slovenia
-
 Somalia
-
 South Africa
-
 Spain
-
 Sri Lanka
-
 Sweden
-
 Switzerland
-
 Syria
-
 Taiwan
-
 Tajikistan
-
 Tanzania
-
 Thailand
-
 Trinidad and Tobago
-
 Tunisia
-
 Turkey
-
 UAE
-
 Uganda
-
 Ukraine
-
 United Kingdom
-
United States
-
 Uruguay
-
 Uzbekistan
-
 Venezuela
-
 Vietnam
-
 Yemen
-
 Zambia
-
 Zimbabwe
- Forex
- Crypto












