

What's behind Jito's latest 11.3% price pullback?

Jito (JTO) fell sharply by 11.3% as sustained selling pressure and negative technical momentum dominated trading. The move is reinforced by the asset trading well below all major moving averages, with a bearish trend structure and downside signals from multiple indicators.
 0.2756
0.3445
Highlights
- JTO/USD remains below all key moving averages, establishing a bearish trend across short, medium, and long timeframes.
- Momentum indicators confirm downside pressure with oversold readings, bearish MACD, and sellers dominating intraday activity.
- The five-day trading range is projected at $0.3265 to $0.4126, with a 78% probability of further decline if support breaks.
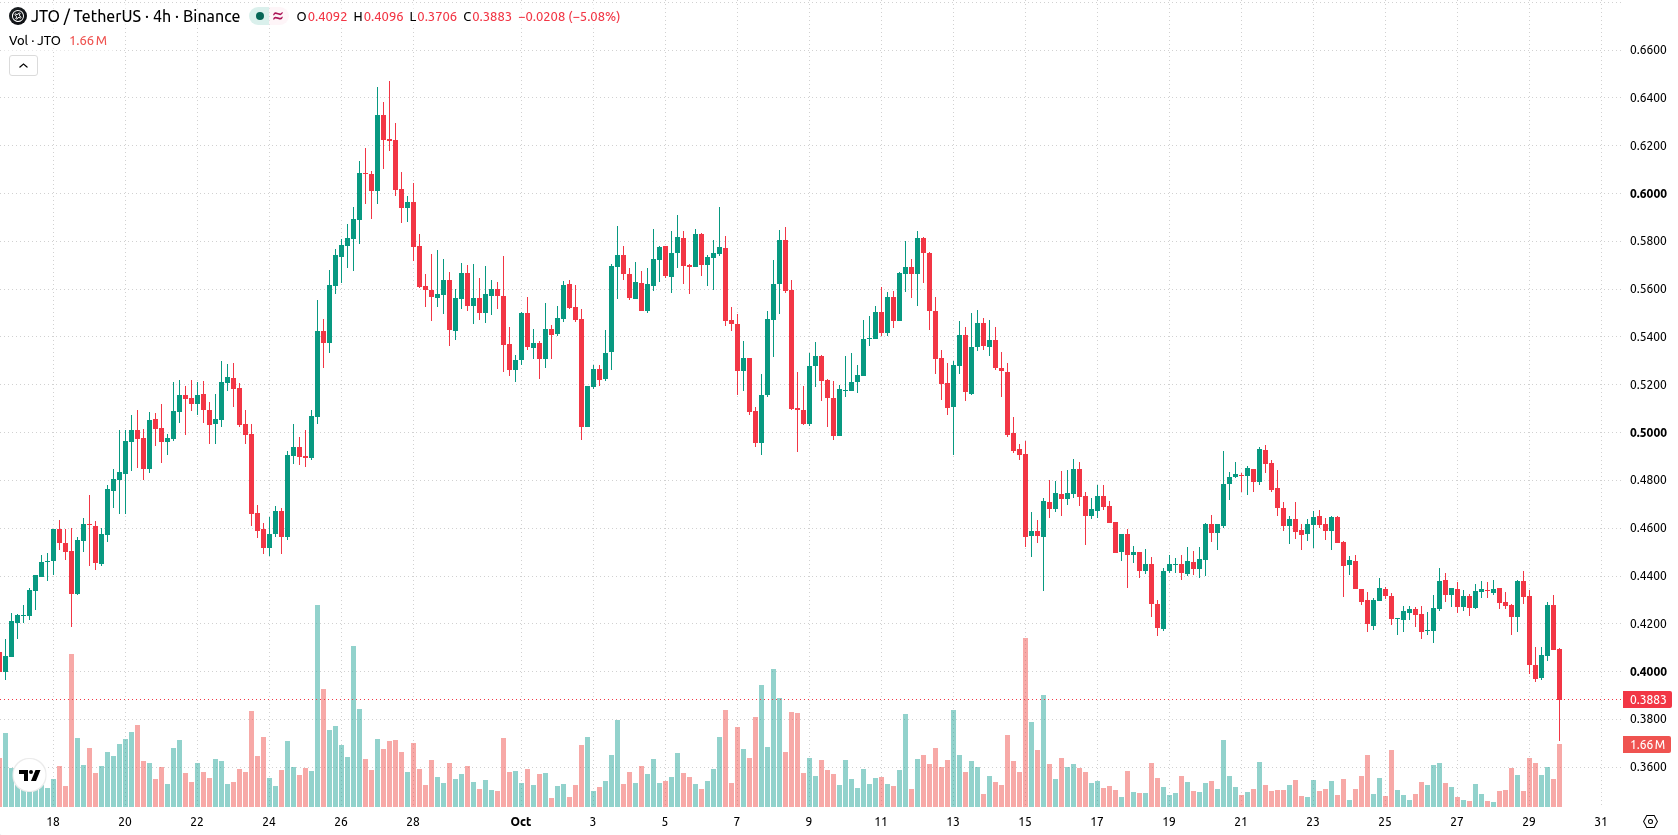
Bearish momentum entrenched as JTO trades below key averages
JTO/USD continues to trade well below its 20-day ($0.4736), 50-day ($0.4915), and 200-day ($0.5245) moving averages, reflecting persistent downward pressure across all timeframes. The 50-day and 200-day alignment confirms a bearish longer-term structure. Immediate resistance stands at $0.3955, while the next key support is the forecast band bottom at $0.3265. Momentum indicators show selling domination: the MACD signals a prevailing bearish trend, the ADX trend strength is neutral, and the RSI is weak at 39. Both the CCI and Stochastic RSI indicate oversold conditions, with intraday action driven by sellers as reflected by BBP and the Awesome Oscillator. Volatility remains elevated at 9.76%.
Previously it was reported that Jito was experiencing sustained bearish momentum, with technical indicators highlighting ongoing downside risks. The current analysis not only confirms this prevailing negative trend but also emphasizes that traders should closely monitor the $0.3265 support level, as a breakdown could lead to accelerated losses.










-
 Afghanistan
-
 Albania
-
 Algeria
-
 Angola
-
 Argentina
-
 Armenia
-
 Australia
-
 Austria
-
 Azerbaijan
-
 Bahamas
-
 Bahrain
-
 Bangladesh
-
 Belarus
-
 Belgium
-
 Bolivia
-
 Botswana
-
 Brazil
-
 Brunei
-
 Bulgaria
-
 Cambodia
-
 Cameroon
-
 Canada
-
 Chile
-
 China
-
 Colombia
-
 Congo
-
 Costa Rica
-
 Cote d'Ivoire
-
 Croatia
-
 Cuba
-
 Cyprus
-
 Czechia
-
 DR Congo
-
 Denmark
-
 Dominican Republic
-
 Ecuador
-
 Egypt
-
 El Salvador
-
 Estonia
-
 Eswatini
-
 Ethiopia
-
 Finland
-
 France
-
 Georgia
-
 Germany
-
 Ghana
-
 Greece
-
 Haiti
-
 Hong Kong
-
 Hungary
-
 India
-
 Indonesia
-
 Iran, Islamic republic
-
 Iraq
-
 Ireland
-
 Israel
-
 Italy
-
 Jamaica
-
 Japan
-
 Jordan
-
 Kazakhstan
-
 Kenya
-
 Korea
-
 Kuwait
-
 Kyrgyzstan
-
 Laos
-
 Latvia
-
 Lebanon
-
 Lesotho
-
 Libya
-
 Lithuania
-
 Luxembourg
-
 Madagascar
-
 Malaysia
-
 Malta
-
 Mauritius
-
 Mexico
-
 Moldova
-
 Mongolia
-
 Montenegro
-
 Morocco
-
 Mozambique
-
 Myanmar
-
 Namibia
-
 Nepal
-
 Netherlands
-
 New Zealand
-
 Nigeria
-
 North Macedonia
-
 Norway
-
 Oman
-
 Pakistan
-
 Palestine
-
 Panama
-
 Papua New Guinea
-
 Paraguay
-
 Peru
-
 Philippines
-
 Poland
-
 Portugal
-
 Puerto Rico
-
 Qatar
-
 Reunion
-
 Romania
-
 Rwanda
-
 Saudi Arabia
-
 Serbia
-
 Singapore
-
 Slovakia
-
 Slovenia
-
 Somalia
-
 South Africa
-
 Spain
-
 Sri Lanka
-
 Sweden
-
 Switzerland
-
 Syria
-
 Taiwan
-
 Tajikistan
-
 Tanzania
-
 Thailand
-
 Trinidad and Tobago
-
 Tunisia
-
 Turkey
-
 UAE
-
 Uganda
-
 Ukraine
-
 United Kingdom
-
United States
-
 Uruguay
-
 Uzbekistan
-
 Venezuela
-
 Vietnam
-
 Yemen
-
 Zambia
-
 Zimbabwe
- Forex
- Crypto












