


Flow (FLOW) sold off 10.95% as strong technical selling pressure drove the move lower. The downtrend is supported by the asset trading below key moving averages, with sellers dominating momentum indicators.
 0.0231
0.0263
Highlights
- FLOW/USD trades below key moving averages, confirming a persistent bearish trend across all timeframes.
- Momentum indicators show strong downside pressure with oversold conditions and sellers dominating intraday action.
- Price is expected to stay in a narrow band from $0.0197 to $0.0253, with a high probability of further declines.
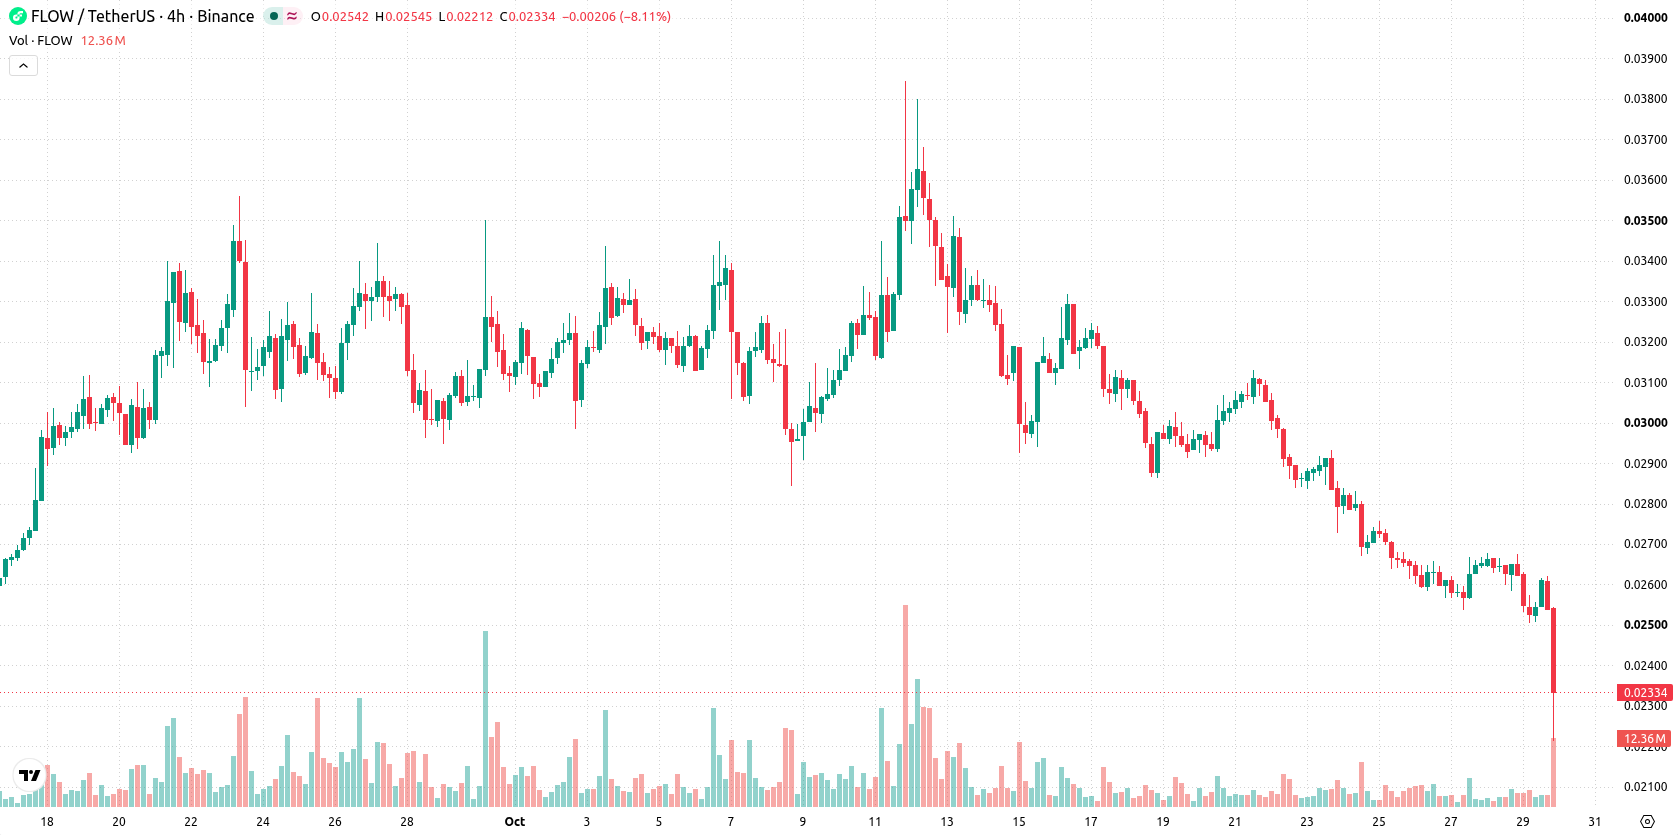
Bearish pressure persists as key averages break and momentum stays weak
FLOW/USD is trading below the 20-day, 50-day, and 200-day moving averages, with the respective levels at $0.0301, $0.0303, and $0.0309. This alignment indicates sustained pressure from sellers across short, medium, and long-term trends, with near-term resistance at $0.0251 and support at $0.0197. The overall trend structure is reinforced as bearish by the position of the Ichimoku Kijun at $0.0319, well above the current price. Momentum indicators show strong downside pressure: the MACD remains in sell territory and the ADX signals a lack of a strong trend. The RSI at 36.43 and CCI at -115.86 both reflect oversold conditions, and the Stochastic RSI reading of 14.02 signals the same. Bull/Bear Power (BBP) is negative, confirming sellers dominate intraday action along with oversold forecasts from oscillators, with the Awesome Oscillator (AO) also supporting the bearish trend. FLOW/USD is quoted at $0.0234 after slipping 10.95% on the day, opening nearly flat and finishing near session lows. Intraday volatility stands at 4.78%. The tone reflects persistent downside pressure and a lack of recovery attempts.
Earlier, analysts noted that Flow was experiencing persistent technical weakness with prevailing downside risks. The latest data strengthens this outlook, highlighting the need for traders to closely monitor $0.0197 as the critical support level that could define the near-term direction.






Latest FLOW News




-
 Afghanistan
-
 Albania
-
 Algeria
-
 Angola
-
 Argentina
-
 Armenia
-
 Australia
-
 Austria
-
 Azerbaijan
-
 Bahamas
-
 Bahrain
-
 Bangladesh
-
 Belarus
-
 Belgium
-
 Bolivia
-
 Botswana
-
 Brazil
-
 Brunei
-
 Bulgaria
-
 Cambodia
-
 Cameroon
-
 Canada
-
 Chile
-
 China
-
 Colombia
-
 Congo
-
 Costa Rica
-
 Cote d'Ivoire
-
 Croatia
-
 Cuba
-
 Cyprus
-
 Czechia
-
 DR Congo
-
 Denmark
-
 Dominican Republic
-
 Ecuador
-
 Egypt
-
 El Salvador
-
 Estonia
-
 Eswatini
-
 Ethiopia
-
 Finland
-
 France
-
 Georgia
-
 Germany
-
 Ghana
-
 Greece
-
 Haiti
-
 Hong Kong
-
 Hungary
-
 India
-
 Indonesia
-
 Iran, Islamic republic
-
 Iraq
-
 Ireland
-
 Israel
-
 Italy
-
 Jamaica
-
 Japan
-
 Jordan
-
 Kazakhstan
-
 Kenya
-
 Korea
-
 Kuwait
-
 Kyrgyzstan
-
 Laos
-
 Latvia
-
 Lebanon
-
 Lesotho
-
 Libya
-
 Lithuania
-
 Luxembourg
-
 Madagascar
-
 Malaysia
-
 Malta
-
 Mauritius
-
 Mexico
-
 Moldova
-
 Mongolia
-
 Montenegro
-
 Morocco
-
 Mozambique
-
 Myanmar
-
 Namibia
-
 Nepal
-
 Netherlands
-
 New Zealand
-
 Nigeria
-
 North Macedonia
-
 Norway
-
 Oman
-
 Pakistan
-
 Palestine
-
 Panama
-
 Papua New Guinea
-
 Paraguay
-
 Peru
-
 Philippines
-
 Poland
-
 Portugal
-
 Puerto Rico
-
 Qatar
-
 Reunion
-
 Romania
-
 Rwanda
-
 Saudi Arabia
-
 Serbia
-
 Singapore
-
 Slovakia
-
 Slovenia
-
 Somalia
-
 South Africa
-
 Spain
-
 Sri Lanka
-
 Sweden
-
 Switzerland
-
 Syria
-
 Taiwan
-
 Tajikistan
-
 Tanzania
-
 Thailand
-
 Trinidad and Tobago
-
 Tunisia
-
 Turkey
-
 UAE
-
 Uganda
-
 Ukraine
-
 United Kingdom
-
United States
-
 Uruguay
-
 Uzbekistan
-
 Venezuela
-
 Vietnam
-
 Yemen
-
 Zambia
-
 Zimbabwe
- Forex
- Crypto












