

Render weekly forecast: Seven-day slide tests buyer resolve with probability of further decrease high

Render Network (RENDER) is trading around $1.57 after a nearly 7% drop over the past week. A sharp decline has pulled the token into oversold territory, putting the focus squarely on whether support levels can hold or set up a near-term rebound in the coming week.
 1.594
1.7400
Highlights
- Render trades at $1.573, down 6.71% for the week, now below key moving averages, indicating a weak technical setup.
- Oscillators diverge as CCI shows an oversold reading, suggesting selling exhaustion could prompt a short-term rebound.
- The trading range for the next 7 days is projected at $1.4031 to $1.7428, with resistance at $1.6743 and support at $1.45.
Revenue surge and governance vote fuel debate on sustainability this week
Render led all AI crypto tokens in Q3 2026 revenue, bringing in $23.3 million according to TokenPost. Of this total, $21.4 million was generated in September, which raises questions about whether this rapid growth pace can continue. Additionally, TradingView reported that a governance vote (RNP-024) was launched from October 28 to October 31 to consider adding Forth as a private AI model gateway and introducing new incentives.
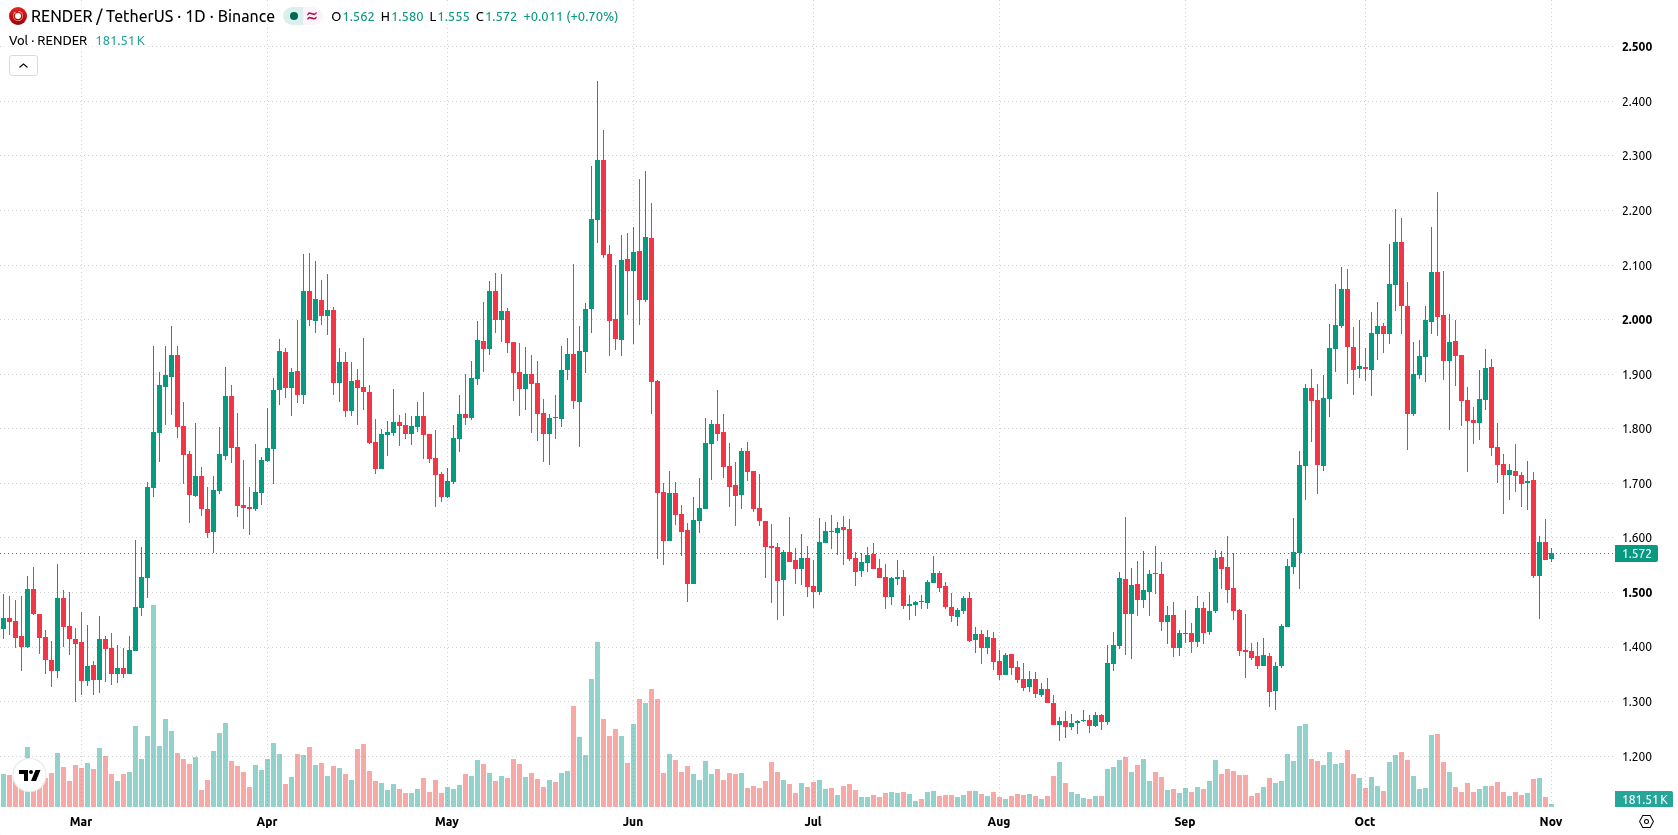
Bearish momentum intensifies as high volatility meets diverging oscillators
On the daily chart, price action has experienced a sharp move lower without forming a sustained trend, as evidenced by high volatility at 22.14%. The CCI is in the oversold zone at -118.8771, indicating possible selling exhaustion and increasing risk of a short-term rebound, while MACD and the Awesome Oscillator both signal continued downside momentum. Immediate support lies at $1.45, with resistance at the MA-200 level of $1.6743 and the Ichimoku Kijun acting as additional resistance at $1.8415. With oscillators diverging—CCI oversold, while RSI and Stoch RSI remain neutral—the overall setup tilts bearish but with the potential for a near-term uptick if support holds.
Downside favored this week unless $1.6743 resistance triggers reversal
For the next 7 days, the expected range is $1.4031 to $1.7428. There is a very high probability of a decrease (more than 80%) and a very low probability of an increase (less than 20%). The base case anticipates continued consolidation between $1.45 and $1.6743. A move above resistance at $1.6743 could trigger short-covering toward $1.7428, while a break below $1.45 would open risk toward the lower boundary at $1.4031.
Earlier, analysts noted that Render remained under sustained downside pressure with technicals favoring further weakness. The latest developments reinforce this bearish outlook, with traders advised to monitor the $1.45 support level as a potential inflection point for near-term price direction.










-
 Afghanistan
-
 Albania
-
 Algeria
-
 Angola
-
 Argentina
-
 Armenia
-
 Australia
-
 Austria
-
 Azerbaijan
-
 Bahamas
-
 Bahrain
-
 Bangladesh
-
 Belarus
-
 Belgium
-
 Bolivia
-
 Botswana
-
 Brazil
-
 Brunei
-
 Bulgaria
-
 Cambodia
-
 Cameroon
-
 Canada
-
 Chile
-
 China
-
 Colombia
-
 Congo
-
 Costa Rica
-
 Cote d'Ivoire
-
 Croatia
-
 Cuba
-
 Cyprus
-
 Czechia
-
 DR Congo
-
 Denmark
-
 Dominican Republic
-
 Ecuador
-
 Egypt
-
 El Salvador
-
 Estonia
-
 Eswatini
-
 Ethiopia
-
 Finland
-
 France
-
 Georgia
-
 Germany
-
 Ghana
-
 Greece
-
 Haiti
-
 Hong Kong
-
 Hungary
-
 India
-
 Indonesia
-
 Iran, Islamic republic
-
 Iraq
-
 Ireland
-
 Israel
-
 Italy
-
 Jamaica
-
 Japan
-
 Jordan
-
 Kazakhstan
-
 Kenya
-
 Korea
-
 Kuwait
-
 Kyrgyzstan
-
 Laos
-
 Latvia
-
 Lebanon
-
 Lesotho
-
 Libya
-
 Lithuania
-
 Luxembourg
-
 Madagascar
-
 Malaysia
-
 Malta
-
 Mauritius
-
 Mexico
-
 Moldova
-
 Mongolia
-
 Montenegro
-
 Morocco
-
 Mozambique
-
 Myanmar
-
 Namibia
-
 Nepal
-
 Netherlands
-
 New Zealand
-
 Nigeria
-
 North Macedonia
-
 Norway
-
 Oman
-
 Pakistan
-
 Palestine
-
 Panama
-
 Papua New Guinea
-
 Paraguay
-
 Peru
-
 Philippines
-
 Poland
-
 Portugal
-
 Puerto Rico
-
 Qatar
-
 Reunion
-
 Romania
-
 Rwanda
-
 Saudi Arabia
-
 Serbia
-
 Singapore
-
 Slovakia
-
 Slovenia
-
 Somalia
-
 South Africa
-
 Spain
-
 Sri Lanka
-
 Sweden
-
 Switzerland
-
 Syria
-
 Taiwan
-
 Tajikistan
-
 Tanzania
-
 Thailand
-
 Trinidad and Tobago
-
 Tunisia
-
 Turkey
-
 UAE
-
 Uganda
-
 Ukraine
-
 United Kingdom
-
United States
-
 Uruguay
-
 Uzbekistan
-
 Venezuela
-
 Vietnam
-
 Yemen
-
 Zambia
-
 Zimbabwe
- Forex
- Crypto












