

XPL slides over 10% as XPL trades below daily moving averages amid intense liquidations

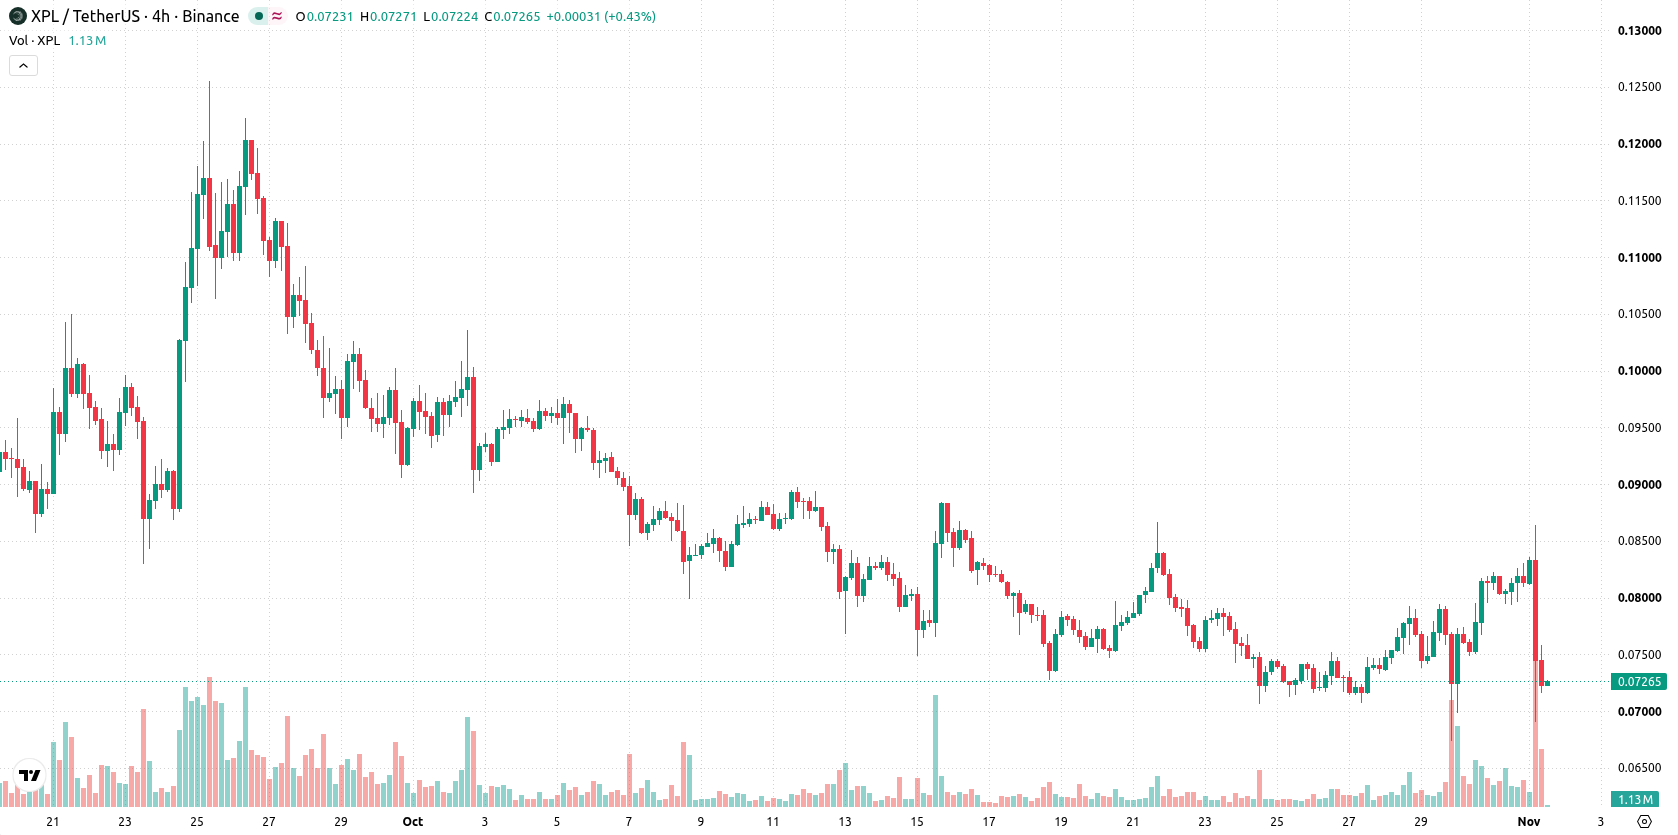
Plasma (XPL) slumped 10.17% after a surge in liquidations linked to XPL-related positions triggered heavy trading activity and intensified selling pressure. The slide is reinforced by the fact that XPL remains below all key daily moving averages, pointing to sustained market weakness.
 0.0715
0.0864
Highlights
- $24.49 million in liquidations involving Plasma occurred within an hour, with $556,000 in losses at the HLP vault on Hyperliquid.
- Market capitalization was near $344 million as trading volume more than doubled the 30-day average during a session of sharp downward pressure.
- XPL/USD trades below key daily moving averages with mixed momentum signals, expected to range from $0.0646 to $0.0804 in the next five days.
Record liquidations and trading surge deepen session’s downward momentum
On November 1, 2026, approximately $24.49 million in liquidations tied to positions involving Plasma were reported within a single hour, with related losses at the HLP vault on Hyperliquid estimated at $556,000. Market capitalization stood near $344 million as trading volume spiked to more than double its 30-day average, consistent with a period of intense activity. These developments accompanied pronounced downward pressure during the session.
Divergent momentum signals as XPL tests support on high volatility
XPL/USD is trading below all key daily moving averages, with the last price at $0.0725, beneath the MA-20 at $0.0782, the MA-50 at $0.0869, and the MA-200 at $0.0891. This alignment indicates ongoing pressure from sellers across short, medium, and long-term trends, with the Ichimoku Kijun at $0.0811 and a bearish bias shown by the MA-50 vs MA-200 alignment. The near-term ceiling is at $0.0782, and support sits near the session low at $0.069. Momentum signals are mixed: the Moving Average Convergence Divergence (MACD) projects a strong sell, and the Average Directional Index (ADX) is neutral. The Relative Strength Index (RSI) is mid-range at 52, hinting at neither overbought nor oversold conditions, but the Stochastic RSI at 100 highlights an overbought situation, confirmed by a bullish forecast from the Commodity Channel Index (CCI) and BBP. Bull/Bear Power (BBP) is positive, showing buyers dominate intraday, with the overbought Stochastic RSI suggesting short-term caution. The pair is down $0.0082 or 10.17% on broad intraday volatility (25.22%), having opened with an upside gap of roughly $0.0006 (0.74%), then slipping toward the lower end of the day's range. There is ongoing pressure after the open, and momentum indicators present a clear divergence between negative trend signals and persistent underlying buying interest.
Earlier, analysts noted that Plasma faced persistent downside risk due to subdued buying interest and a weak technical outlook. The latest liquidation-driven drop and mixed momentum signals highlight an uncertain near-term bias, with traders advised to monitor the $0.0646 level as a potential inflection point for further volatility.










-
 Afghanistan
-
 Albania
-
 Algeria
-
 Angola
-
 Argentina
-
 Armenia
-
 Australia
-
 Austria
-
 Azerbaijan
-
 Bahamas
-
 Bahrain
-
 Bangladesh
-
 Belarus
-
 Belgium
-
 Bolivia
-
 Botswana
-
 Brazil
-
 Brunei
-
 Bulgaria
-
 Cambodia
-
 Cameroon
-
 Canada
-
 Chile
-
 China
-
 Colombia
-
 Congo
-
 Costa Rica
-
 Cote d'Ivoire
-
 Croatia
-
 Cuba
-
 Cyprus
-
 Czechia
-
 DR Congo
-
 Denmark
-
 Dominican Republic
-
 Ecuador
-
 Egypt
-
 El Salvador
-
 Estonia
-
 Eswatini
-
 Ethiopia
-
 Finland
-
 France
-
 Georgia
-
 Germany
-
 Ghana
-
 Greece
-
 Haiti
-
 Hong Kong
-
 Hungary
-
 India
-
 Indonesia
-
 Iran, Islamic republic
-
 Iraq
-
 Ireland
-
 Israel
-
 Italy
-
 Jamaica
-
 Japan
-
 Jordan
-
 Kazakhstan
-
 Kenya
-
 Korea
-
 Kuwait
-
 Kyrgyzstan
-
 Laos
-
 Latvia
-
 Lebanon
-
 Lesotho
-
 Libya
-
 Lithuania
-
 Luxembourg
-
 Madagascar
-
 Malaysia
-
 Malta
-
 Mauritius
-
 Mexico
-
 Moldova
-
 Mongolia
-
 Montenegro
-
 Morocco
-
 Mozambique
-
 Myanmar
-
 Namibia
-
 Nepal
-
 Netherlands
-
 New Zealand
-
 Nigeria
-
 North Macedonia
-
 Norway
-
 Oman
-
 Pakistan
-
 Palestine
-
 Panama
-
 Papua New Guinea
-
 Paraguay
-
 Peru
-
 Philippines
-
 Poland
-
 Portugal
-
 Puerto Rico
-
 Qatar
-
 Reunion
-
 Romania
-
 Rwanda
-
 Saudi Arabia
-
 Serbia
-
 Singapore
-
 Slovakia
-
 Slovenia
-
 Somalia
-
 South Africa
-
 Spain
-
 Sri Lanka
-
 Sweden
-
 Switzerland
-
 Syria
-
 Taiwan
-
 Tajikistan
-
 Tanzania
-
 Thailand
-
 Trinidad and Tobago
-
 Tunisia
-
 Turkey
-
 UAE
-
 Uganda
-
 Ukraine
-
 United Kingdom
-
United States
-
 Uruguay
-
 Uzbekistan
-
 Venezuela
-
 Vietnam
-
 Yemen
-
 Zambia
-
 Zimbabwe
- Forex
- Crypto












