

Will Maple hold $0.1429 support amid ongoing withdrawal risk and persistent selling pressure?

Maple (SYRUP) is trading at $0.1515, down 7% on the day and holding close to the session low. The asset sits below its key moving averages, reflecting persistent intraday pressure and heightened volatility.
 0.1556
0.1765
Highlights
- Maple Finance's syrupUSDC and syrupUSDT lending pools lack withdrawal deadlines, exposing users to unpredictable fund access and heightened liquidity risks.
- Selling shares in these pools on the open market can occur below net asset value, increasing potential losses during periods of heavy withdrawals.
- SYRUP/USD trades below key moving averages with sustained downside pressure, targeting a short-term range of $0.1429 to $0.1601 and a high probability of further declines.
Withdrawal delays and discounted sales intensify structural liquidity risk
Maple Finance's lending pools syrupUSDC and syrupUSDT operate with no guaranteed deadlines for user withdrawals, which means participants may encounter uncertain wait times before accessing funds. According to Phemex, while selling shares on the open market offers an alternative to waiting in the withdrawal queue, such sales can occur at values below the underlying pool's net asset value, introducing added risk of losses for users. These conditions create structural liquidity risks and can dampen market sentiment by amplifying downside pressure during periods of active withdrawals.
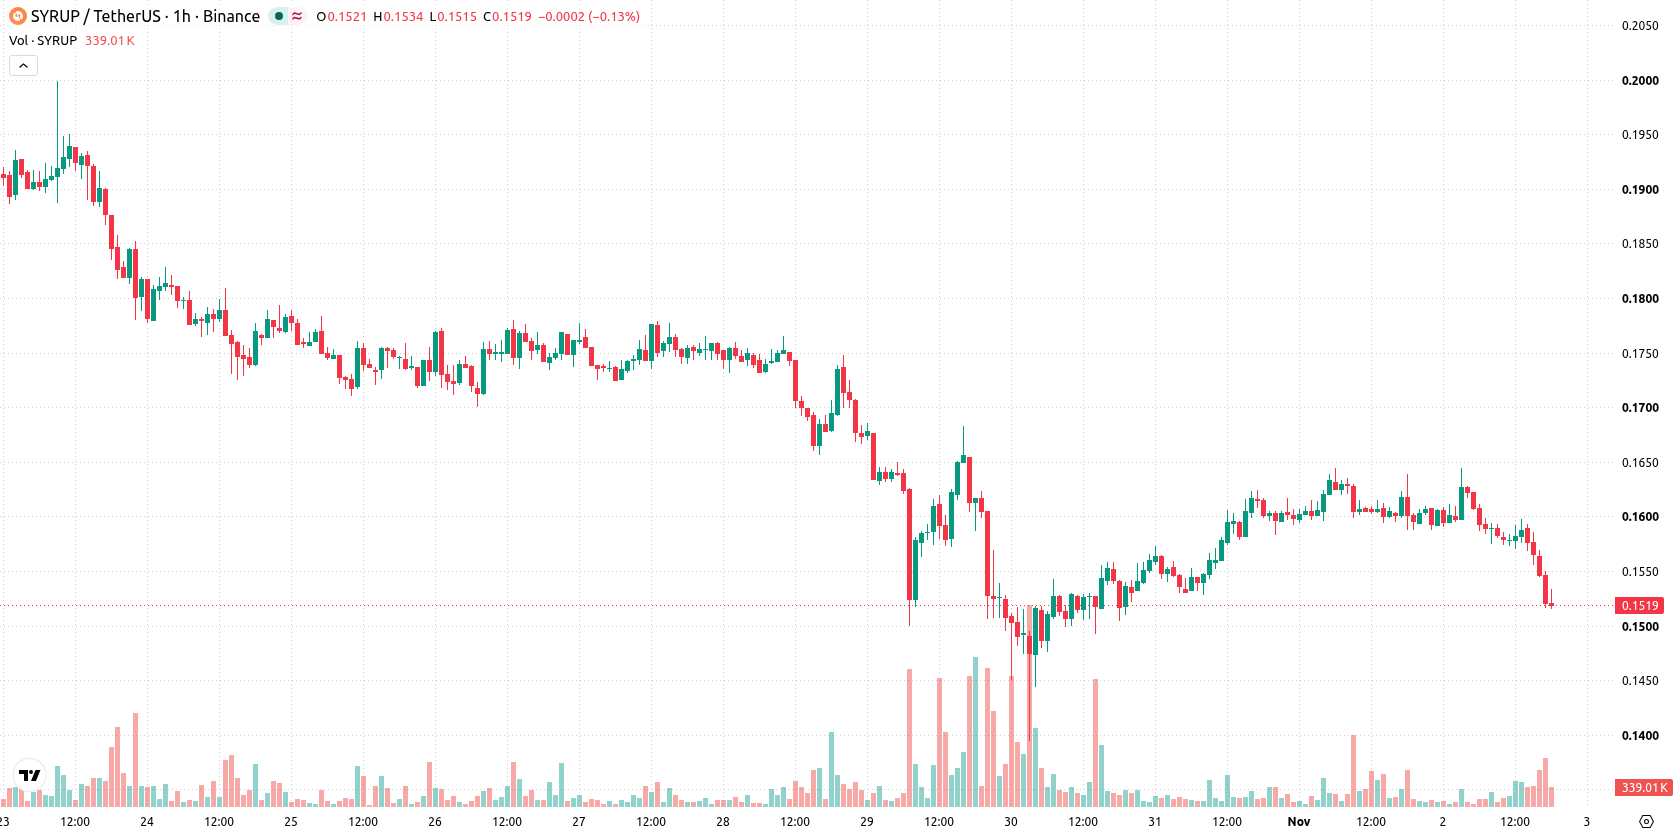
Bearish signals persist as momentum lags beneath resistance thresholds
SYRUP/USD sits beneath the MA-20 at $0.1588 and MA-50 at $0.16 on the hourly timeframe, with daily MA-200 overhead at $0.1909. The Ichimoku Kijun acts as immediate resistance at $0.1594. MACD and Bull/Bear Power both highlight prevailing seller dominance, while the ADX remains neutral. Current RSI is 30.8, with both Stoch RSI and CCI flagging oversold conditions, hinting at short-term exhaustion rather than a confirmed reversal. The Awesome Oscillator (AO) continues to point toward bearish momentum as price trades with high volatility near the session’s low.
Downside bias persists as volatility band suggests limited rebound
Over the coming 2–3 trading days, SYRUP/USD is expected to fluctuate within a volatility band between $0.1429 and $0.1601. The likelihood of an upward move is very low, with downside continuation much more probable given both the technical structure and momentum indicators. A break above $0.1594 would be required to open the path for a bullish scenario, while the loss of support at $0.1429 could accelerate further declines. The baseline scenario favors consolidation within this corridor, absent a clear reversal trigger.
Earlier, analysts noted that Maple’s strong collateralization and bullish momentum were underpinning a possible shift to a more positive trend. Current conditions indicate market pressure has intensified, with structural liquidity constraints and persistent technical weakness now highlighting $0.1429 as the critical support level to watch for further downside risk.










-
 Afghanistan
-
 Albania
-
 Algeria
-
 Angola
-
 Argentina
-
 Armenia
-
 Australia
-
 Austria
-
 Azerbaijan
-
 Bahamas
-
 Bahrain
-
 Bangladesh
-
 Belarus
-
 Belgium
-
 Bolivia
-
 Botswana
-
 Brazil
-
 Brunei
-
 Bulgaria
-
 Cambodia
-
 Cameroon
-
 Canada
-
 Chile
-
 China
-
 Colombia
-
 Congo
-
 Costa Rica
-
 Cote d'Ivoire
-
 Croatia
-
 Cuba
-
 Cyprus
-
 Czechia
-
 DR Congo
-
 Denmark
-
 Dominican Republic
-
 Ecuador
-
 Egypt
-
 El Salvador
-
 Estonia
-
 Eswatini
-
 Ethiopia
-
 Finland
-
 France
-
 Georgia
-
 Germany
-
 Ghana
-
 Greece
-
 Haiti
-
 Hong Kong
-
 Hungary
-
 India
-
 Indonesia
-
 Iran, Islamic republic
-
 Iraq
-
 Ireland
-
 Israel
-
 Italy
-
 Jamaica
-
 Japan
-
 Jordan
-
 Kazakhstan
-
 Kenya
-
 Korea
-
 Kuwait
-
 Kyrgyzstan
-
 Laos
-
 Latvia
-
 Lebanon
-
 Lesotho
-
 Libya
-
 Lithuania
-
 Luxembourg
-
 Madagascar
-
 Malaysia
-
 Malta
-
 Mauritius
-
 Mexico
-
 Moldova
-
 Mongolia
-
 Montenegro
-
 Morocco
-
 Mozambique
-
 Myanmar
-
 Namibia
-
 Nepal
-
 Netherlands
-
 New Zealand
-
 Nigeria
-
 North Macedonia
-
 Norway
-
 Oman
-
 Pakistan
-
 Palestine
-
 Panama
-
 Papua New Guinea
-
 Paraguay
-
 Peru
-
 Philippines
-
 Poland
-
 Portugal
-
 Puerto Rico
-
 Qatar
-
 Reunion
-
 Romania
-
 Rwanda
-
 Saudi Arabia
-
 Serbia
-
 Singapore
-
 Slovakia
-
 Slovenia
-
 Somalia
-
 South Africa
-
 Spain
-
 Sri Lanka
-
 Sweden
-
 Switzerland
-
 Syria
-
 Taiwan
-
 Tajikistan
-
 Tanzania
-
 Thailand
-
 Trinidad and Tobago
-
 Tunisia
-
 Turkey
-
 UAE
-
 Uganda
-
 Ukraine
-
 United Kingdom
-
United States
-
 Uruguay
-
 Uzbekistan
-
 Venezuela
-
 Vietnam
-
 Yemen
-
 Zambia
-
 Zimbabwe
- Forex
- Crypto












