

Voyager chain launch has limited impact as Celestia clings to support: weekly analysis

Celestia (TIA) continues to weaken, trading around $0.44 after a steep drop of roughly 17% over the past week. The chart reveals persistent selling momentum as the market reacts to extended downside pressure, putting support levels into sharper focus for the days ahead.
 0.4479
0.5697
Highlights
- Celestia trades at $0.4378 after falling 17.02% in the past 7 days, with short-term downside pressure evident.
- The asset remains below its 20-day and 50-day moving averages and above the 200-day, indicating a bullish long-term structure but weak near-term momentum.
- For the next 7 days, Celestia is projected to trade between $0.3502 and $0.5253, with support at $0.4023 and resistance at $0.5002.
Voyager launch and support breach reinforce bearish sentiment
Celestia has officially launched Voyager, a new payment chain aimed at enabling high-volume transactions for AI agents, with benchmark tests showing over 21 million transactions per second according to KuCoin. Voyager leverages Celestia's modular design and Fibre protocol to support autonomous micropayments at scale. Meanwhile, technical analysis points to continued bearish momentum since TIA broke below a key support threshold in recent sessions (source: CryptoNews.net).
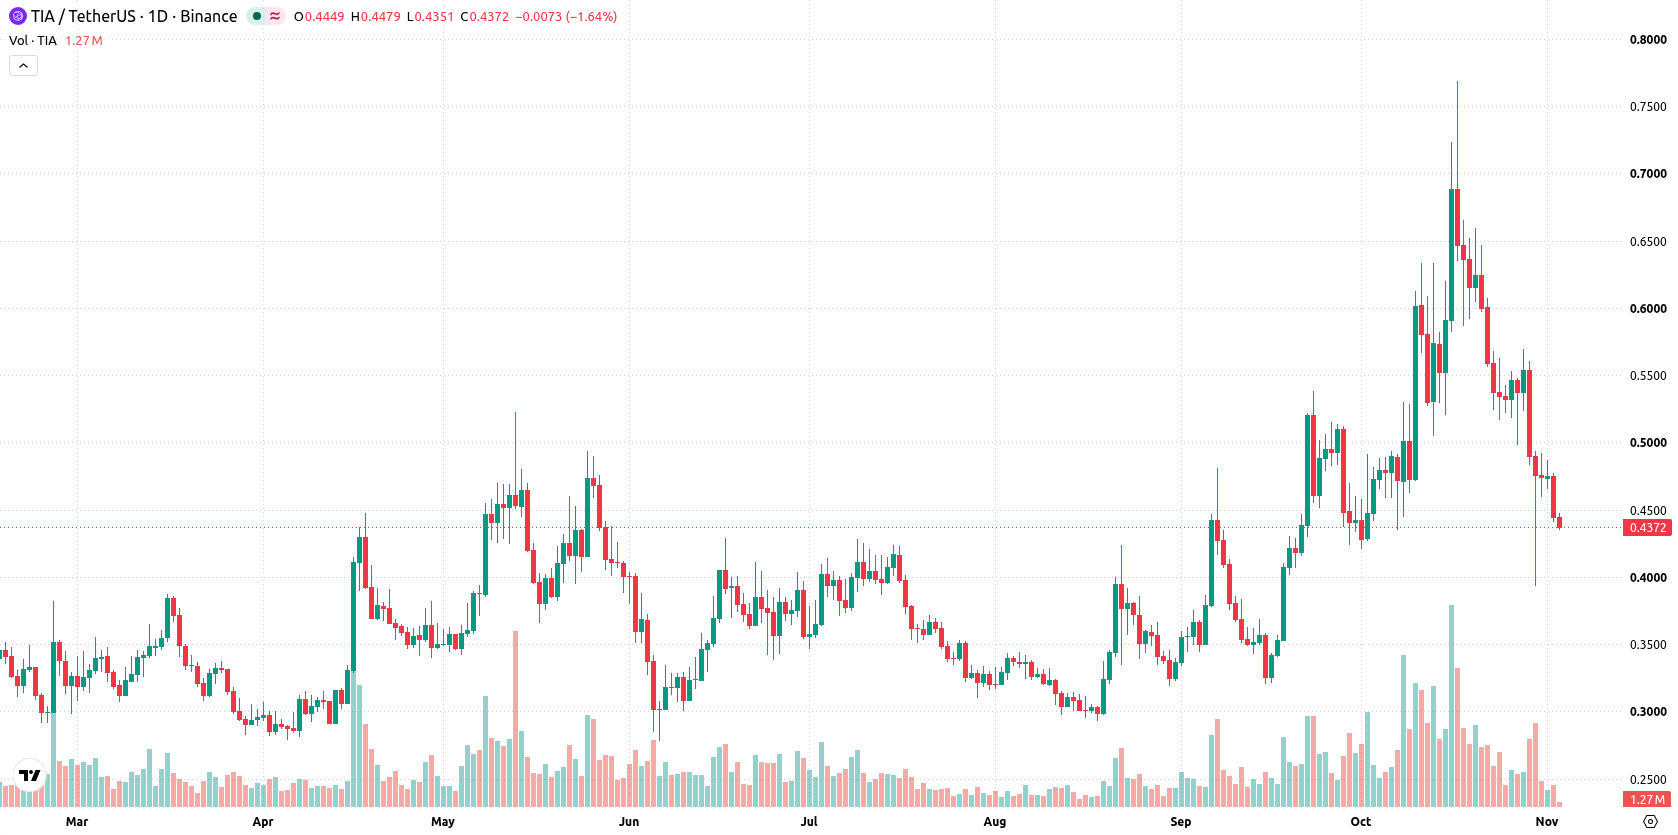
Bearish momentum holds as oversold signals and volatility spike
The daily chart highlights a sustained move lower with a firm trend, as volatility surged to 44.78%. CCI and Stochastic RSI both post oversold readings, while RSI is neutral. However, directional momentum indicators—including ADX, Bull/Bear Power, and the HMA—point to ongoing selling pressure. The nearest support is anchored at $0.4023, while resistance stands at $0.5002.
Downside bias persists next week unless resistance is breached
For the next 7 days, Celestia is expected to trade in a $0.3502 to $0.5253 range, with a 27% chance of an increase and 73% chance of a decrease. The base case favors continued pressure within this range. A close above $0.5002 would open up the prospect of a reversal higher. If price slips below $0.4023 support, further downside risk emerges.
Earlier, analysts noted that Celestia was experiencing increased volatility and mixed momentum signals, with the potential for either consolidation or a shift in direction hinging on key technical levels. With current conditions pointing to dominant selling pressure and heightened downside risk, traders should monitor whether price action remains above $0.4023 or breaks lower to signal further weakness ahead.










-
 Afghanistan
-
 Albania
-
 Algeria
-
 Angola
-
 Argentina
-
 Armenia
-
 Australia
-
 Austria
-
 Azerbaijan
-
 Bahamas
-
 Bahrain
-
 Bangladesh
-
 Belarus
-
 Belgium
-
 Bolivia
-
 Botswana
-
 Brazil
-
 Brunei
-
 Bulgaria
-
 Cambodia
-
 Cameroon
-
 Canada
-
 Chile
-
 China
-
 Colombia
-
 Congo
-
 Costa Rica
-
 Cote d'Ivoire
-
 Croatia
-
 Cuba
-
 Cyprus
-
 Czechia
-
 DR Congo
-
 Denmark
-
 Dominican Republic
-
 Ecuador
-
 Egypt
-
 El Salvador
-
 Estonia
-
 Eswatini
-
 Ethiopia
-
 Finland
-
 France
-
 Georgia
-
 Germany
-
 Ghana
-
 Greece
-
 Haiti
-
 Hong Kong
-
 Hungary
-
 India
-
 Indonesia
-
 Iran, Islamic republic
-
 Iraq
-
 Ireland
-
 Israel
-
 Italy
-
 Jamaica
-
 Japan
-
 Jordan
-
 Kazakhstan
-
 Kenya
-
 Korea
-
 Kuwait
-
 Kyrgyzstan
-
 Laos
-
 Latvia
-
 Lebanon
-
 Lesotho
-
 Libya
-
 Lithuania
-
 Luxembourg
-
 Madagascar
-
 Malaysia
-
 Malta
-
 Mauritius
-
 Mexico
-
 Moldova
-
 Mongolia
-
 Montenegro
-
 Morocco
-
 Mozambique
-
 Myanmar
-
 Namibia
-
 Nepal
-
 Netherlands
-
 New Zealand
-
 Nigeria
-
 North Macedonia
-
 Norway
-
 Oman
-
 Pakistan
-
 Palestine
-
 Panama
-
 Papua New Guinea
-
 Paraguay
-
 Peru
-
 Philippines
-
 Poland
-
 Portugal
-
 Puerto Rico
-
 Qatar
-
 Reunion
-
 Romania
-
 Rwanda
-
 Saudi Arabia
-
 Serbia
-
 Singapore
-
 Slovakia
-
 Slovenia
-
 Somalia
-
 South Africa
-
 Spain
-
 Sri Lanka
-
 Sweden
-
 Switzerland
-
 Syria
-
 Taiwan
-
 Tajikistan
-
 Tanzania
-
 Thailand
-
 Trinidad and Tobago
-
 Tunisia
-
 Turkey
-
 UAE
-
 Uganda
-
 Ukraine
-
 United Kingdom
-
United States
-
 Uruguay
-
 Uzbekistan
-
 Venezuela
-
 Vietnam
-
 Yemen
-
 Zambia
-
 Zimbabwe
- Forex
- Crypto












