

Injective tests key support zone amid heightened volatility and institutional developments: weekly analysis

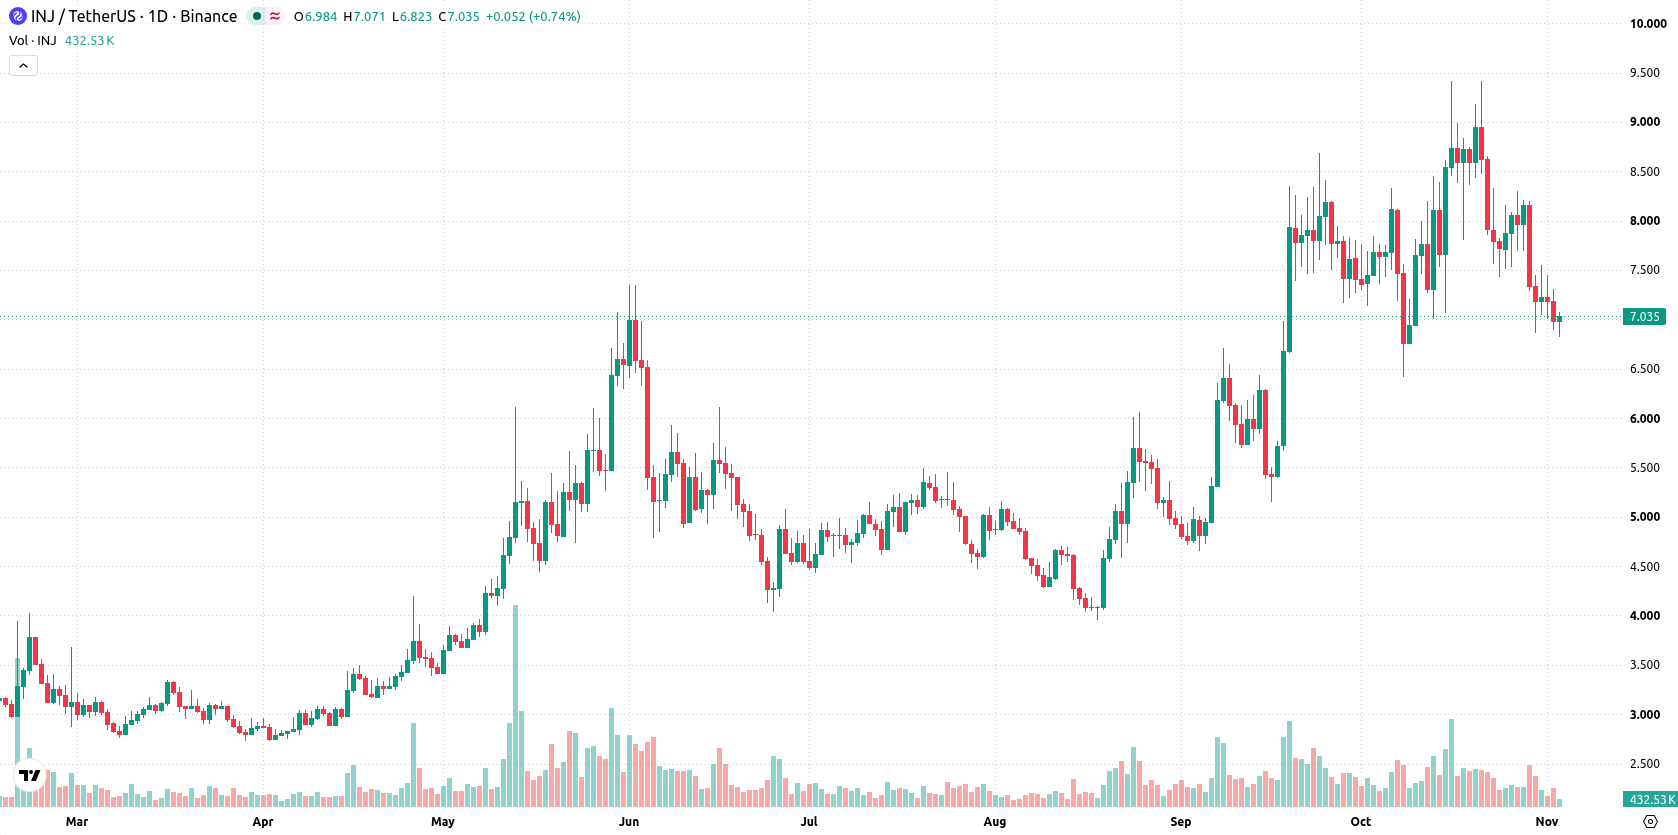
Injective (INJ) slid to around $7.00 this week, losing nearly 10% as several technical indicators show mixed signals. A sharp drop brought oversold conditions, putting focus on whether a major support level will hold or if sellers could push the decline further in the days ahead.
 7.07
8.21
Highlights
- Injective trades at $7.04, down 9.75% over the past week with momentum weakening in the near term.
- Mixed signals from technical indicators show oversold conditions and neutral momentum, suggesting possible short-term volatility and rebound risk.
- The expected range for the coming week is $6.32 to $7.75, with key support at $6.86 and resistance at $7.61.
Feature deployments and supply burns buoy sentiment amid institutional inflows
Injective unveiled its Institutional Rail on November 2, 2026, enabling firms direct API-based access to block production and enhanced pre-commit acknowledgement while preserving validator consensus and user key custody, according to Blockchain.News. The platform also introduced a limited-access priority trading channel for institutional clients in its production phase and deployed on-chain options trading on testnet for indices and commodities, as reported by ChainCatcher. Additionally, a Stockdrop event allowed eligible participants to claim tokenized stocks, with TradingView noting cumulative INJ token burns approaching 7.3 million. Significant portions of INJ supply remain staked, and technical analysis highlights key support at the $6.41 level.
Rebound potential surfaces as mixed momentum signals follow volatile week
On the daily chart, Injective shows a flat trend with a sharp move lower without a sustained trend, as evidenced by the 19.68% volatility this week. Momentum signals are mixed: CCI and Stochastic RSI are both in the oversold zone, suggesting possible rebound potential, while RSI remains neutral at 39.3. The nearest support lies at $6.86, with initial resistance at $7.61 from the 50-day moving average and the Ichimoku Kijun at $7.92 acting as an additional resistance barrier.
Downside bias prevails in coming week with rangebound risk defined by key levels
In the week ahead, a range between $6.32 and $7.75 is expected. Probabilities favor a decrease at 58%, with a 42% chance of an upside move. The base case sees trading contained between $6.86 and $7.61. A close above $7.61 would open room for recovery toward $7.75, while a drop below $6.86 would signal risk of extension down toward $6.32.
Earlier, analysts noted that Injective exhibited firm momentum and a bullish bias as it approached resistance levels despite mixed technical signals. The recent move below $7.00 marks a significant shift, placing emphasis on the $6.86 support as a pivotal level for traders monitoring the risk of further downside.










-
 Afghanistan
-
 Albania
-
 Algeria
-
 Angola
-
 Argentina
-
 Armenia
-
 Australia
-
 Austria
-
 Azerbaijan
-
 Bahamas
-
 Bahrain
-
 Bangladesh
-
 Belarus
-
 Belgium
-
 Bolivia
-
 Botswana
-
 Brazil
-
 Brunei
-
 Bulgaria
-
 Cambodia
-
 Cameroon
-
 Canada
-
 Chile
-
 China
-
 Colombia
-
 Congo
-
 Costa Rica
-
 Cote d'Ivoire
-
 Croatia
-
 Cuba
-
 Cyprus
-
 Czechia
-
 DR Congo
-
 Denmark
-
 Dominican Republic
-
 Ecuador
-
 Egypt
-
 El Salvador
-
 Estonia
-
 Eswatini
-
 Ethiopia
-
 Finland
-
 France
-
 Georgia
-
 Germany
-
 Ghana
-
 Greece
-
 Haiti
-
 Hong Kong
-
 Hungary
-
 India
-
 Indonesia
-
 Iran, Islamic republic
-
 Iraq
-
 Ireland
-
 Israel
-
 Italy
-
 Jamaica
-
 Japan
-
 Jordan
-
 Kazakhstan
-
 Kenya
-
 Korea
-
 Kuwait
-
 Kyrgyzstan
-
 Laos
-
 Latvia
-
 Lebanon
-
 Lesotho
-
 Libya
-
 Lithuania
-
 Luxembourg
-
 Madagascar
-
 Malaysia
-
 Malta
-
 Mauritius
-
 Mexico
-
 Moldova
-
 Mongolia
-
 Montenegro
-
 Morocco
-
 Mozambique
-
 Myanmar
-
 Namibia
-
 Nepal
-
 Netherlands
-
 New Zealand
-
 Nigeria
-
 North Macedonia
-
 Norway
-
 Oman
-
 Pakistan
-
 Palestine
-
 Panama
-
 Papua New Guinea
-
 Paraguay
-
 Peru
-
 Philippines
-
 Poland
-
 Portugal
-
 Puerto Rico
-
 Qatar
-
 Reunion
-
 Romania
-
 Rwanda
-
 Saudi Arabia
-
 Serbia
-
 Singapore
-
 Slovakia
-
 Slovenia
-
 Somalia
-
 South Africa
-
 Spain
-
 Sri Lanka
-
 Sweden
-
 Switzerland
-
 Syria
-
 Taiwan
-
 Tajikistan
-
 Tanzania
-
 Thailand
-
 Trinidad and Tobago
-
 Tunisia
-
 Turkey
-
 UAE
-
 Uganda
-
 Ukraine
-
 United Kingdom
-
United States
-
 Uruguay
-
 Uzbekistan
-
 Venezuela
-
 Vietnam
-
 Yemen
-
 Zambia
-
 Zimbabwe
- Forex
- Crypto












