

Cardano weekly forecast: Resistance at the 20-day moving average caps recovery attempts

Cardano (ADA) is hovering around $0.19 after a sharp drop of nearly 8% over the last week, as persistent selling pressure drives the pace of declines. Regulatory developments and a potential shift in on-chain participation are putting support levels in the spotlight for the week ahead.
 0.169
0.183
Highlights
- Cardano trades at $0.191, down 7.54% over the past 7 days, remaining below key moving averages.
- Daily chart signals strong downward trend with sellers dominating, but some indicators suggest potential for a short-term rebound.
- Expected 7-day trading range is $0.176 to $0.205, with nearest support at $0.182 and 79% probability of further downside.
ETF inclusion offsets bearish flows as institutional interest rises amid weak retail demand
Cardano faces ongoing bearish momentum, with technical and on-chain data reflecting reduced retail demand and long liquidations heavily outweighing shorts, as reported by FXStreet and U.Today. Institutional exposure has increased with Cardano's confirmed inclusion in the Hashdex Nasdaq Crypto Index ETF, though ETF flows trended negative in the latest week according to openPR.com. The Cardano Foundation also announced updates to its blockchain's technical standards, including the implementation of quantum-resistant signature proposals and regulated stablecoin standards, according to crypto.news. Additionally, Cardano will participate in the Blockchain for Humanity panel in Geneva on November 5th, as TradingView reported.
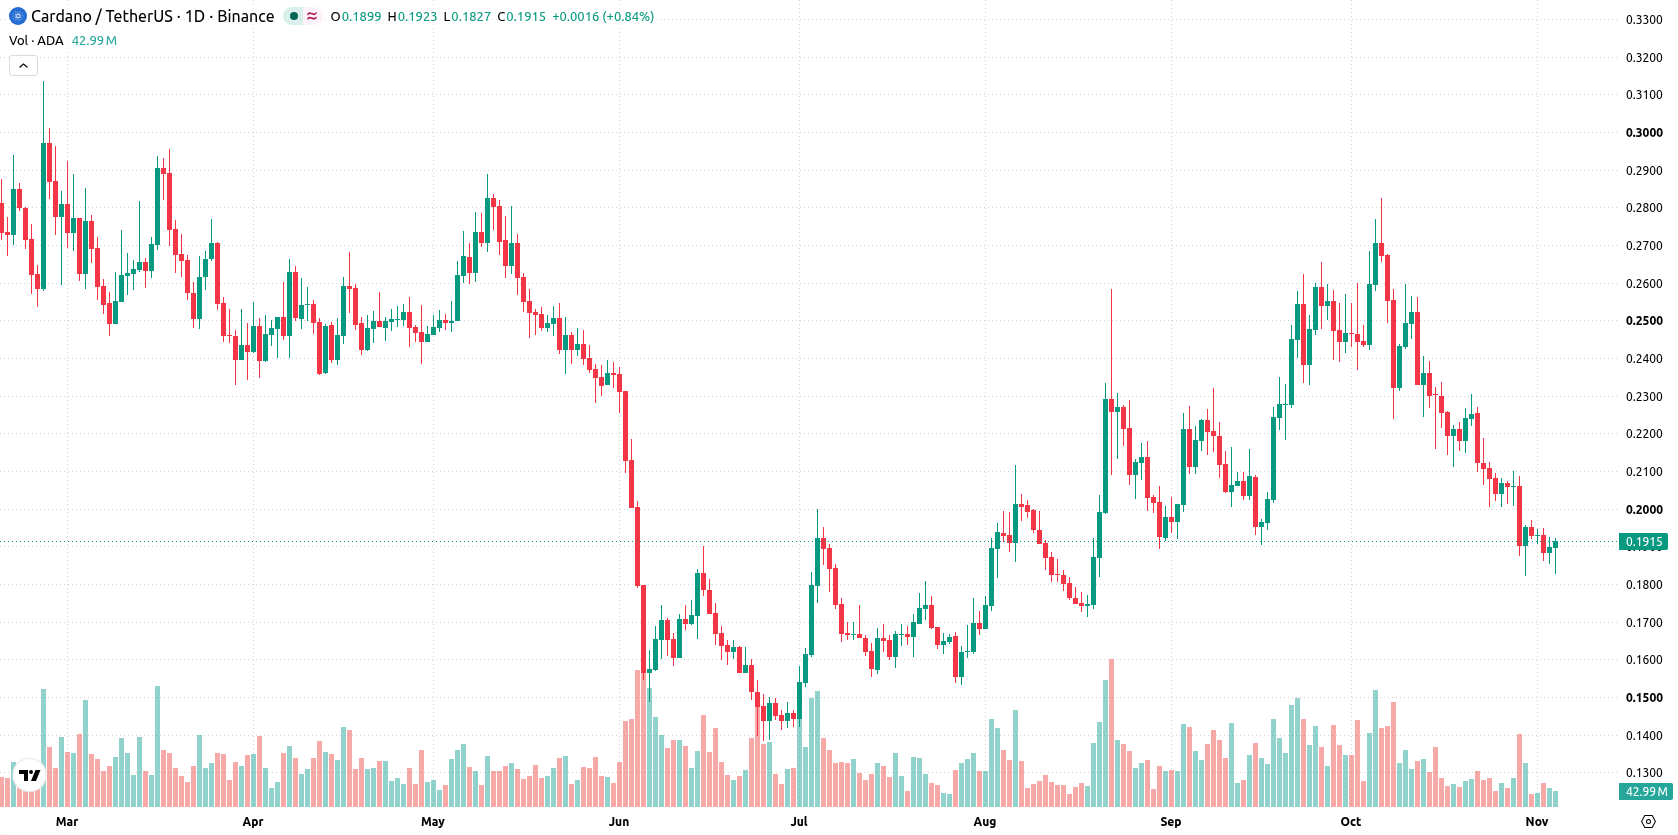
Downside momentum persists as technicals signal oversold conditions this week
On the daily chart, Cardano is showing a sustained move lower with a firm trend, highlighted by strong downside signals from both MACD and ADX. CCI and Stochastic RSI are both in oversold territory, indicating possible selling exhaustion and upside rebound potential even as the trend remains down. Volatility over the past week is elevated at 14.84%. The nearest support sits at $0.182, while resistance is seen at the 20-day moving average of $0.208, with the Ichimoku Kijun at $0.221 also acting as practical resistance.
Downside risk remains elevated unless upside break clears $0.208 in coming week
For the next 7 days, the anticipated range is $0.176 to $0.205 with a 21% probability of an increase and a 79% chance of further downside. The base case is continued trade within this range, as sellers maintain dominance. A sustained push above $0.208 would open the way for a rebound attempt toward the upper band. A drop through support at $0.182 signals risk of extended losses toward the lower end of the expected range.
Previously it was reported that Cardano was under sustained bearish pressure, even as regulatory advances and network developments unfolded. The latest analysis reinforces this direction with fresh signs of dominant selling and increased institutional involvement, underscoring $0.182 as a critical support level to monitor for potential breakdown risk in the coming week.











-
 Afghanistan
-
 Albania
-
 Algeria
-
 Angola
-
 Argentina
-
 Armenia
-
 Australia
-
 Austria
-
 Azerbaijan
-
 Bahamas
-
 Bahrain
-
 Bangladesh
-
 Belarus
-
 Belgium
-
 Bolivia
-
 Botswana
-
 Brazil
-
 Brunei
-
 Bulgaria
-
 Cambodia
-
 Cameroon
-
 Canada
-
 Chile
-
 China
-
 Colombia
-
 Congo
-
 Costa Rica
-
 Cote d'Ivoire
-
 Croatia
-
 Cuba
-
 Cyprus
-
 Czechia
-
 DR Congo
-
 Denmark
-
 Dominican Republic
-
 Ecuador
-
 Egypt
-
 El Salvador
-
 Estonia
-
 Eswatini
-
 Ethiopia
-
 Finland
-
 France
-
 Georgia
-
 Germany
-
 Ghana
-
 Greece
-
 Haiti
-
 Hong Kong
-
 Hungary
-
 India
-
 Indonesia
-
 Iran, Islamic republic
-
 Iraq
-
 Ireland
-
 Israel
-
 Italy
-
 Jamaica
-
 Japan
-
 Jordan
-
 Kazakhstan
-
 Kenya
-
 Korea
-
 Kuwait
-
 Kyrgyzstan
-
 Laos
-
 Latvia
-
 Lebanon
-
 Lesotho
-
 Libya
-
 Lithuania
-
 Luxembourg
-
 Madagascar
-
 Malaysia
-
 Malta
-
 Mauritius
-
 Mexico
-
 Moldova
-
 Mongolia
-
 Montenegro
-
 Morocco
-
 Mozambique
-
 Myanmar
-
 Namibia
-
 Nepal
-
 Netherlands
-
 New Zealand
-
 Nigeria
-
 North Macedonia
-
 Norway
-
 Oman
-
 Pakistan
-
 Palestine
-
 Panama
-
 Papua New Guinea
-
 Paraguay
-
 Peru
-
 Philippines
-
 Poland
-
 Portugal
-
 Puerto Rico
-
 Qatar
-
 Reunion
-
 Romania
-
 Rwanda
-
 Saudi Arabia
-
 Serbia
-
 Singapore
-
 Slovakia
-
 Slovenia
-
 Somalia
-
 South Africa
-
 Spain
-
 Sri Lanka
-
 Sweden
-
 Switzerland
-
 Syria
-
 Taiwan
-
 Tajikistan
-
 Tanzania
-
 Thailand
-
 Trinidad and Tobago
-
 Tunisia
-
 Turkey
-
 UAE
-
 Uganda
-
 Ukraine
-
 United Kingdom
-
United States
-
 Uruguay
-
 Uzbekistan
-
 Venezuela
-
 Vietnam
-
 Yemen
-
 Zambia
-
 Zimbabwe
- Forex
- Crypto












