

Persistent outflows weigh on sentiment: Can ETH weekly outlook break $2,354 resistance?

Ethereum (ETH) struggled to regain ground this week, with the price near $2,322 and a decline of just over 2% driven by persistent investor outflows. As U.S. spot ETF withdrawals mount and selling pressure weighs on sentiment, the upcoming week’s outlook remains capped by resistance levels and continued capital flight from institutional products.
 2242.49
2450.00
Highlights
- Ethereum fell 2.1% on the week to $2,322, trading below short-term averages but above its long-term trend level.
- Momentum indicators show continued selling pressure with neutral oscillators and sellers firmly in control.
- In the coming week, Ethereum is projected to trade between $2,131 and $2,430, with $2,174 as near-term support and $2,354 as resistance.
Record institutional outflows deepen as iShares and BitMine moves highlight divergence
U.S. spot Ethereum ETFs suffered significant net outflows over the past week, marking their worst month since launch, with approximately $1.61 billion withdrawn in October according to BeInCrypto. BlackRock’s iShares Ethereum Trust accounted for the bulk of these outflows, responsible for roughly $1.42 billion in capital exits as reported by KuCoin. Additionally, BitMine, a major institutional holder, expanded its ETH holdings with a 8,573 ETH purchase — a move that only slightly offset the broader selling trend.
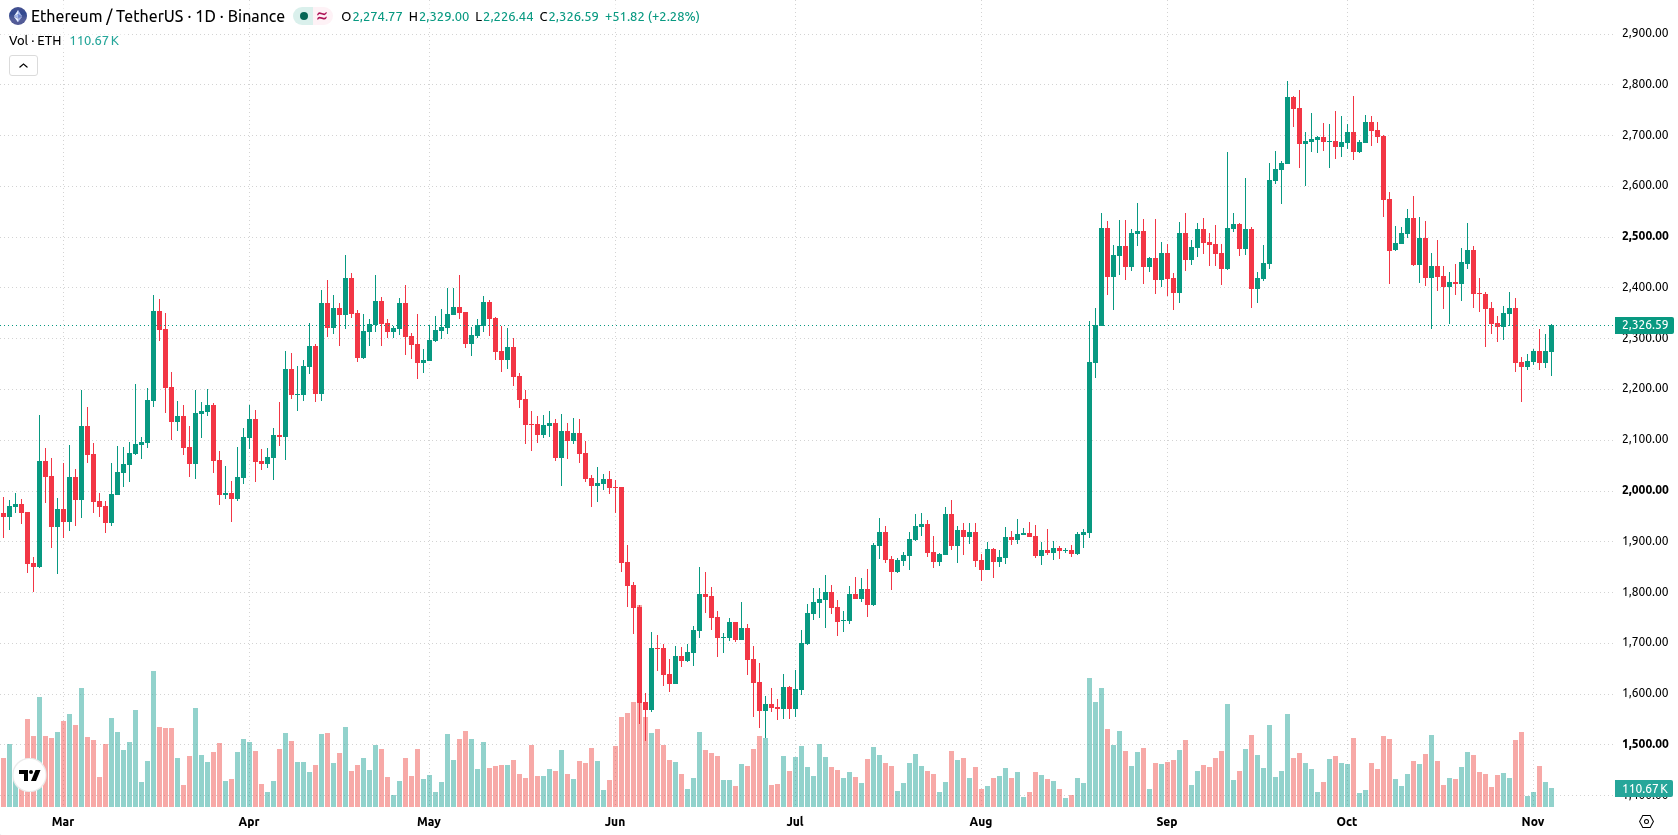
Downside momentum persists as MACD and ADX confirm broad selling this week
On the daily chart, Ethereum’s picture is defined by a sustained move lower with a firm trend, supported by persistent downside signals from both MACD and ADX. Oscillators including the RSI at 38.48 and CCI at -81.02 are in neutral zones, not showing oversold conditions. Bull/Bear Power indicates sellers remain dominant, while volatility stood at 9.45% this week, pointing to a wide trading range. Immediate resistance lines up at $2,354, with $2,174 serving as the nearest support and $2,376 (Ichimoku Kijun) acting as an additional resistance.
Range-bound action likely as resistance and downside risks shape next week’s bias
In the week ahead, Ethereum is expected to trade between $2,131 and $2,430, with a 27% probability of an increase and a 73% probability of a decrease. If price remains contained between support at $2,174 and resistance at $2,354, further choppy downside is likely. A break above $2,354 would challenge $2,376 and open the way toward the upper end of the expected range. Sustained weakness below $2,174 would signal added downside risk toward $2,131.
Earlier, analysts noted that Ethereum was struggling to sustain a decisive recovery amid persistent ETF outflows and ongoing market volatility. Recent data reinforces this outlook, with continued institutional withdrawals signaling that downside risk remains prevalent and traders should monitor the $2,131–$2,430 range for emerging breaks.






Latest Ethereum News




-
 Afghanistan
-
 Albania
-
 Algeria
-
 Angola
-
 Argentina
-
 Armenia
-
 Australia
-
 Austria
-
 Azerbaijan
-
 Bahamas
-
 Bahrain
-
 Bangladesh
-
 Belarus
-
 Belgium
-
 Bolivia
-
 Botswana
-
 Brazil
-
 Brunei
-
 Bulgaria
-
 Cambodia
-
 Cameroon
-
 Canada
-
 Chile
-
 China
-
 Colombia
-
 Congo
-
 Costa Rica
-
 Cote d'Ivoire
-
 Croatia
-
 Cuba
-
 Cyprus
-
 Czechia
-
 DR Congo
-
 Denmark
-
 Dominican Republic
-
 Ecuador
-
 Egypt
-
 El Salvador
-
 Estonia
-
 Eswatini
-
 Ethiopia
-
 Finland
-
 France
-
 Georgia
-
 Germany
-
 Ghana
-
 Greece
-
 Haiti
-
 Hong Kong
-
 Hungary
-
 India
-
 Indonesia
-
 Iran, Islamic republic
-
 Iraq
-
 Ireland
-
 Israel
-
 Italy
-
 Jamaica
-
 Japan
-
 Jordan
-
 Kazakhstan
-
 Kenya
-
 Korea
-
 Kuwait
-
 Kyrgyzstan
-
 Laos
-
 Latvia
-
 Lebanon
-
 Lesotho
-
 Libya
-
 Lithuania
-
 Luxembourg
-
 Madagascar
-
 Malaysia
-
 Malta
-
 Mauritius
-
 Mexico
-
 Moldova
-
 Mongolia
-
 Montenegro
-
 Morocco
-
 Mozambique
-
 Myanmar
-
 Namibia
-
 Nepal
-
 Netherlands
-
 New Zealand
-
 Nigeria
-
 North Macedonia
-
 Norway
-
 Oman
-
 Pakistan
-
 Palestine
-
 Panama
-
 Papua New Guinea
-
 Paraguay
-
 Peru
-
 Philippines
-
 Poland
-
 Portugal
-
 Puerto Rico
-
 Qatar
-
 Reunion
-
 Romania
-
 Rwanda
-
 Saudi Arabia
-
 Serbia
-
 Singapore
-
 Slovakia
-
 Slovenia
-
 Somalia
-
 South Africa
-
 Spain
-
 Sri Lanka
-
 Sweden
-
 Switzerland
-
 Syria
-
 Taiwan
-
 Tajikistan
-
 Tanzania
-
 Thailand
-
 Trinidad and Tobago
-
 Tunisia
-
 Turkey
-
 UAE
-
 Uganda
-
 Ukraine
-
 United Kingdom
-
United States
-
 Uruguay
-
 Uzbekistan
-
 Venezuela
-
 Vietnam
-
 Yemen
-
 Zambia
-
 Zimbabwe
- Forex
- Crypto












