

S gains over 10% as intraday buying picks up despite resistance at $0.044

Sonic (S, formerly Fantom) jumped 10.34% as a surge in intraday buying followed strong volatility and sellers showing signs of exhaustion. The move remains limited, with the price still below the 20-day and 50-day moving averages and facing resistance at $0.044.
 0.0344
0.0393
Highlights
- S/USD is trading at $0.0426, up 10.34% and near the day high following substantial intraday volatility.
- The asset trades below key short- and medium-term moving averages but remains structurally supported above the 200-day level.
- Momentum indicators are mixed with oversold oscillators and strong trend readings, projecting a likely sideways move from $0.0312 to $0.0501 with a 62% chance of downside.
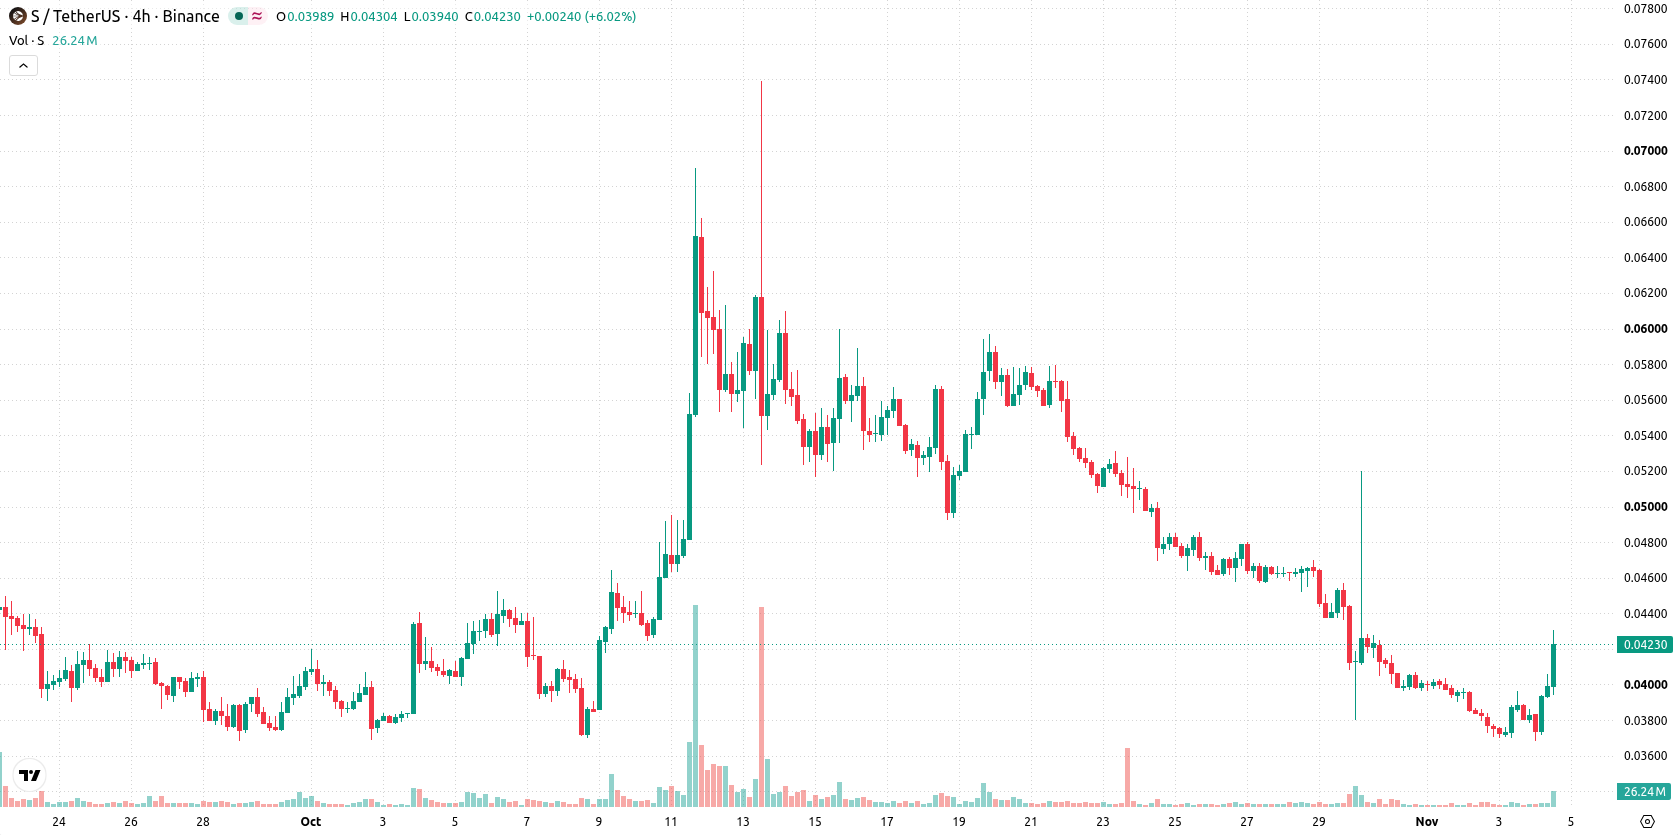
Persistent selling pressure as mixed momentum clouds technical outlook
S/USD is trading below the 20-day ($0.0482) and 50-day ($0.044) moving averages, but it remains above the 200-day at $0.035. This indicates persistent selling pressure in the short and medium term, while the bullish alignment of the 50-day versus the 200-day moving average provides underlying structural support. The immediate resistance is at $0.044, with the closest support at $0.0406. Momentum indicators present a mixed picture: the MACD signals weakness, the ADX points to trend strength, the RSI is neutral, the Stochastic RSI and CCI are both in the oversold zone, and the BBP and AO confirm selling still dominates intraday activity. Buyers have taken control after the open, but momentum and oscillators highlight a divergence.
Earlier, analysts noted a shift in Sonic's technical outlook toward renewed bullish momentum, with traders monitoring for a decisive breakout. The current analysis adds a neutral-to-cautious note, highlighting that despite a recent rebound, traders should watch for a sustained move above $0.044 to indicate a more durable trend reversal.










-
 Afghanistan
-
 Albania
-
 Algeria
-
 Angola
-
 Argentina
-
 Armenia
-
 Australia
-
 Austria
-
 Azerbaijan
-
 Bahamas
-
 Bahrain
-
 Bangladesh
-
 Belarus
-
 Belgium
-
 Bolivia
-
 Botswana
-
 Brazil
-
 Brunei
-
 Bulgaria
-
 Cambodia
-
 Cameroon
-
 Canada
-
 Chile
-
 China
-
 Colombia
-
 Congo
-
 Costa Rica
-
 Cote d'Ivoire
-
 Croatia
-
 Cuba
-
 Cyprus
-
 Czechia
-
 DR Congo
-
 Denmark
-
 Dominican Republic
-
 Ecuador
-
 Egypt
-
 El Salvador
-
 Estonia
-
 Eswatini
-
 Ethiopia
-
 Finland
-
 France
-
 Georgia
-
 Germany
-
 Ghana
-
 Greece
-
 Haiti
-
 Hong Kong
-
 Hungary
-
 India
-
 Indonesia
-
 Iran, Islamic republic
-
 Iraq
-
 Ireland
-
 Israel
-
 Italy
-
 Jamaica
-
 Japan
-
 Jordan
-
 Kazakhstan
-
 Kenya
-
 Korea
-
 Kuwait
-
 Kyrgyzstan
-
 Laos
-
 Latvia
-
 Lebanon
-
 Lesotho
-
 Libya
-
 Lithuania
-
 Luxembourg
-
 Madagascar
-
 Malaysia
-
 Malta
-
 Mauritius
-
 Mexico
-
 Moldova
-
 Mongolia
-
 Montenegro
-
 Morocco
-
 Mozambique
-
 Myanmar
-
 Namibia
-
 Nepal
-
 Netherlands
-
 New Zealand
-
 Nigeria
-
 North Macedonia
-
 Norway
-
 Oman
-
 Pakistan
-
 Palestine
-
 Panama
-
 Papua New Guinea
-
 Paraguay
-
 Peru
-
 Philippines
-
 Poland
-
 Portugal
-
 Puerto Rico
-
 Qatar
-
 Reunion
-
 Romania
-
 Rwanda
-
 Saudi Arabia
-
 Serbia
-
 Singapore
-
 Slovakia
-
 Slovenia
-
 Somalia
-
 South Africa
-
 Spain
-
 Sri Lanka
-
 Sweden
-
 Switzerland
-
 Syria
-
 Taiwan
-
 Tajikistan
-
 Tanzania
-
 Thailand
-
 Trinidad and Tobago
-
 Tunisia
-
 Turkey
-
 UAE
-
 Uganda
-
 Ukraine
-
 United Kingdom
-
United States
-
 Uruguay
-
 Uzbekistan
-
 Venezuela
-
 Vietnam
-
 Yemen
-
 Zambia
-
 Zimbabwe
- Forex
- Crypto












