

RAY rallies over 12% as technical resistance meets increased trading activity

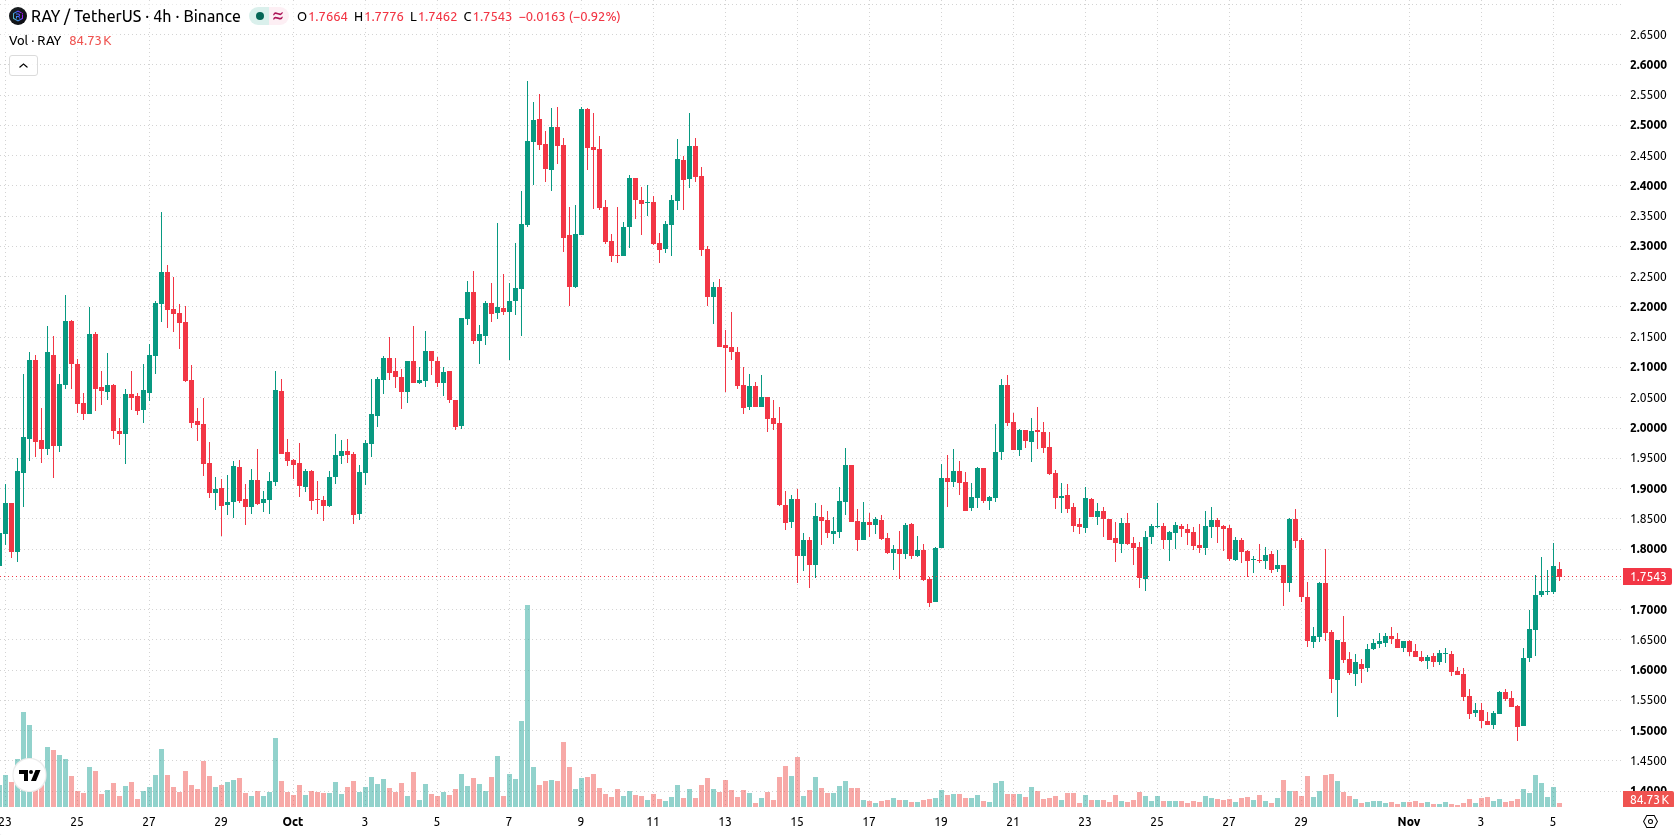
Raydium (RAY) rallied 12.36% as traders drove demand in the absence of fundamental news, highlighting a surge powered by market activity instead of confirmed events. The move looks limited, with the price still trading below both the 20-day and 50-day moving averages, signaling that underlying technical structure offers resistance.
 1.7186
1.8648
Highlights
- Raydium experienced a sharp price increase on November 4 and 5, 2026, with no confirmed protocol, technical, or regulatory triggers reported.
- Market action is attributed to trading activity rather than internal developments, with Raydium operations and usage levels remaining stable.
- RAY/USD trades below key short- and medium-term moving averages, with expected five-day range at $1.5825 to $1.9034 and a 55% probability of upward movement.
Lack of protocol updates fuels speculation behind price surge
Raydium saw a significant price increase on November 4 and 5, 2026, with no confirmed protocol updates, technical incidents, or regulatory events reported to explain the movement. Available data does not indicate changes in on-chain activity, derivatives, or protocol usage. Raydium continues to function as a decentralized exchange protocol built on Solana, and the recent action is attributed to market trading activity rather than any confirmed internal developments.
Mixed momentum signals as major averages set resistance boundaries
RAY/USD is trading below its 20-day ($1.7676) and 50-day ($1.906) moving averages, signaling persistent short- to medium-term selling pressure. However, it holds well above the 200-day average ($1.0291), confirming a longer-term bullish structure. The pair is testing resistance at the near-term ceiling of $1.76, with immediate support at $1.7246. Major averages above price currently act as trend confirmation rather than barriers. On the daily timeframe, momentum signals are mixed: the MACD and Average Directional Index indicate selling pressure is present, while both the Commodity Channel Index and Relative Strength Index are neutral, indicating no extreme condition. Stochastic RSI signals an overbought reading, pointing to downside correction risk. Bull/Bear Power shows intraday buyer dominance, but the Awesome Oscillator does not confirm a strong trend. RAY/USD is trading near its session high, with intraday volatility at 2.05%. Despite underlying strength, diverging momentum signals caution at current levels.
Earlier, analysts noted that Raydium’s price action was characterized by ongoing short- to medium-term selling pressure, even as the longer-term bullish structure remained intact above key averages. The current article reinforces this view, highlighting that consolidation remains likely and traders should monitor the $1.7246 support and $1.76 resistance levels for potential directional cues.










-
 Afghanistan
-
 Albania
-
 Algeria
-
 Angola
-
 Argentina
-
 Armenia
-
 Australia
-
 Austria
-
 Azerbaijan
-
 Bahamas
-
 Bahrain
-
 Bangladesh
-
 Belarus
-
 Belgium
-
 Bolivia
-
 Botswana
-
 Brazil
-
 Brunei
-
 Bulgaria
-
 Cambodia
-
 Cameroon
-
 Canada
-
 Chile
-
 China
-
 Colombia
-
 Congo
-
 Costa Rica
-
 Cote d'Ivoire
-
 Croatia
-
 Cuba
-
 Cyprus
-
 Czechia
-
 DR Congo
-
 Denmark
-
 Dominican Republic
-
 Ecuador
-
 Egypt
-
 El Salvador
-
 Estonia
-
 Eswatini
-
 Ethiopia
-
 Finland
-
 France
-
 Georgia
-
 Germany
-
 Ghana
-
 Greece
-
 Haiti
-
 Hong Kong
-
 Hungary
-
 India
-
 Indonesia
-
 Iran, Islamic republic
-
 Iraq
-
 Ireland
-
 Israel
-
 Italy
-
 Jamaica
-
 Japan
-
 Jordan
-
 Kazakhstan
-
 Kenya
-
 Korea
-
 Kuwait
-
 Kyrgyzstan
-
 Laos
-
 Latvia
-
 Lebanon
-
 Lesotho
-
 Libya
-
 Lithuania
-
 Luxembourg
-
 Madagascar
-
 Malaysia
-
 Malta
-
 Mauritius
-
 Mexico
-
 Moldova
-
 Mongolia
-
 Montenegro
-
 Morocco
-
 Mozambique
-
 Myanmar
-
 Namibia
-
 Nepal
-
 Netherlands
-
 New Zealand
-
 Nigeria
-
 North Macedonia
-
 Norway
-
 Oman
-
 Pakistan
-
 Palestine
-
 Panama
-
 Papua New Guinea
-
 Paraguay
-
 Peru
-
 Philippines
-
 Poland
-
 Portugal
-
 Puerto Rico
-
 Qatar
-
 Reunion
-
 Romania
-
 Rwanda
-
 Saudi Arabia
-
 Serbia
-
 Singapore
-
 Slovakia
-
 Slovenia
-
 Somalia
-
 South Africa
-
 Spain
-
 Sri Lanka
-
 Sweden
-
 Switzerland
-
 Syria
-
 Taiwan
-
 Tajikistan
-
 Tanzania
-
 Thailand
-
 Trinidad and Tobago
-
 Tunisia
-
 Turkey
-
 UAE
-
 Uganda
-
 Ukraine
-
 United Kingdom
-
United States
-
 Uruguay
-
 Uzbekistan
-
 Venezuela
-
 Vietnam
-
 Yemen
-
 Zambia
-
 Zimbabwe
- Forex
- Crypto












