

FLOW extends decline as seller pressure weighs on momentum

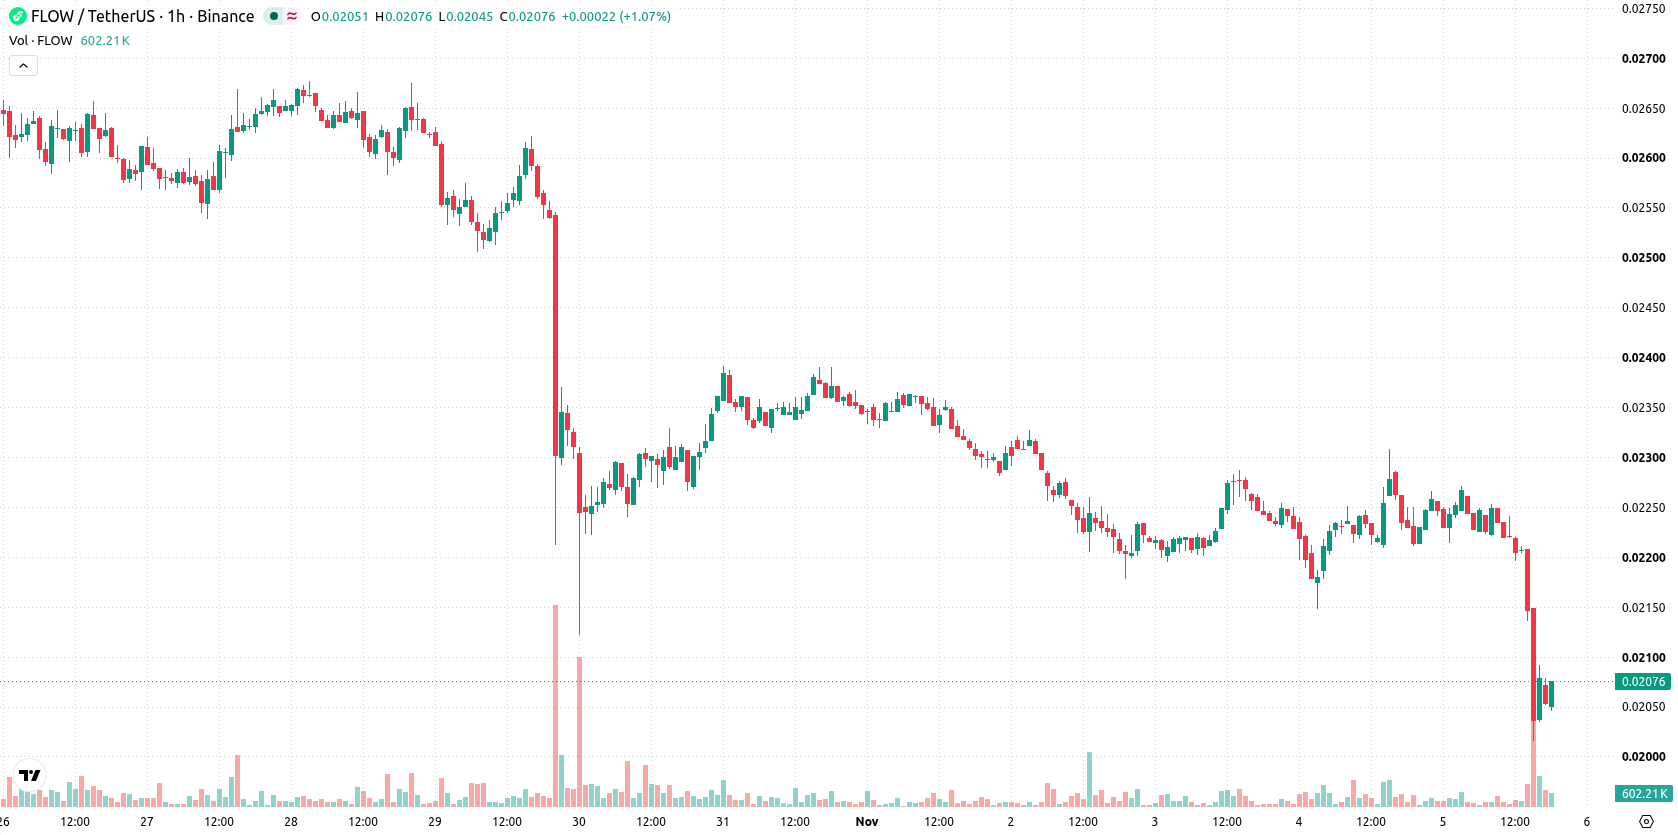
Flow (FLOW) is trading at $0.0207, down 7.48% on the day and showing a continued decline, with the price holding below its short- and long-term moving averages. The asset remains under pronounced pressure as it sits near the lowest point of today's trading range.
 0.018
0.0210
Highlights
- FLOW/USD trades firmly below short-, medium-, and long-term moving averages, confirming persistent downward price pressure.
- Momentum and oscillator indicators collectively signal a bearish trend, with key indicators registering oversold or negative territory.
- Price stands at $0.0207, down 7.48% daily, with an expected 2 to 3 day range of $0.0179 to $0.0213 and a very high probability of further downside.
Technical downtrend as indicators confirm persistent selling
On the hourly chart, FLOW/USD currently trades below its MA-20 ($0.0221) and MA-50 ($0.0222), with the longer-term MA-200 well above at $0.0305. The Ichimoku Kijun stands at $0.0215 as immediate resistance, while support is seen near $0.0179. Momentum indicators confirm strong selling: both MACD and ADX have generated sell signals, while the RSI (29.52) and CCI (-202.63) remain firmly in oversold territory. Bull/Bear Power is negative, underscoring intraday seller dominance, and the Awesome Oscillator aligns with this downtrend. Stochastic RSI, however, registers a neutral condition—suggesting partial divergence within oscillators.
Rangebound outlook as downside risks remain elevated
Over the next 2–3 days, FLOW is expected to trade within a range of $0.0179 to $0.0213, reflecting typical volatility relative to current levels. With a very high probability of continued downside and a low chance of upward reversal, the baseline scenario calls for the price to remain rangebound near present lows. Any bullish scenario would require a breakout above the $0.0215 resistance, while a decisive drop below $0.0179 could trigger a deeper move lower.
Earlier, analysts noted that Flow remained under sustained bearish pressure amid persistent technical weakness. The current analysis confirms this view, with the prevailing scenario calling for continued caution as traders monitor the $0.0179 support for signs of further downside.










-
 Afghanistan
-
 Albania
-
 Algeria
-
 Angola
-
 Argentina
-
 Armenia
-
 Australia
-
 Austria
-
 Azerbaijan
-
 Bahamas
-
 Bahrain
-
 Bangladesh
-
 Belarus
-
 Belgium
-
 Bolivia
-
 Botswana
-
 Brazil
-
 Brunei
-
 Bulgaria
-
 Cambodia
-
 Cameroon
-
 Canada
-
 Chile
-
 China
-
 Colombia
-
 Congo
-
 Costa Rica
-
 Cote d'Ivoire
-
 Croatia
-
 Cuba
-
 Cyprus
-
 Czechia
-
 DR Congo
-
 Denmark
-
 Dominican Republic
-
 Ecuador
-
 Egypt
-
 El Salvador
-
 Estonia
-
 Eswatini
-
 Ethiopia
-
 Finland
-
 France
-
 Georgia
-
 Germany
-
 Ghana
-
 Greece
-
 Haiti
-
 Hong Kong
-
 Hungary
-
 India
-
 Indonesia
-
 Iran, Islamic republic
-
 Iraq
-
 Ireland
-
 Israel
-
 Italy
-
 Jamaica
-
 Japan
-
 Jordan
-
 Kazakhstan
-
 Kenya
-
 Korea
-
 Kuwait
-
 Kyrgyzstan
-
 Laos
-
 Latvia
-
 Lebanon
-
 Lesotho
-
 Libya
-
 Lithuania
-
 Luxembourg
-
 Madagascar
-
 Malaysia
-
 Malta
-
 Mauritius
-
 Mexico
-
 Moldova
-
 Mongolia
-
 Montenegro
-
 Morocco
-
 Mozambique
-
 Myanmar
-
 Namibia
-
 Nepal
-
 Netherlands
-
 New Zealand
-
 Nigeria
-
 North Macedonia
-
 Norway
-
 Oman
-
 Pakistan
-
 Palestine
-
 Panama
-
 Papua New Guinea
-
 Paraguay
-
 Peru
-
 Philippines
-
 Poland
-
 Portugal
-
 Puerto Rico
-
 Qatar
-
 Reunion
-
 Romania
-
 Rwanda
-
 Saudi Arabia
-
 Serbia
-
 Singapore
-
 Slovakia
-
 Slovenia
-
 Somalia
-
 South Africa
-
 Spain
-
 Sri Lanka
-
 Sweden
-
 Switzerland
-
 Syria
-
 Taiwan
-
 Tajikistan
-
 Tanzania
-
 Thailand
-
 Trinidad and Tobago
-
 Tunisia
-
 Turkey
-
 UAE
-
 Uganda
-
 Ukraine
-
 United Kingdom
-
United States
-
 Uruguay
-
 Uzbekistan
-
 Venezuela
-
 Vietnam
-
 Yemen
-
 Zambia
-
 Zimbabwe
- Forex
- Crypto












