

What's behind Uniswap's latest 9.5% price pullback?

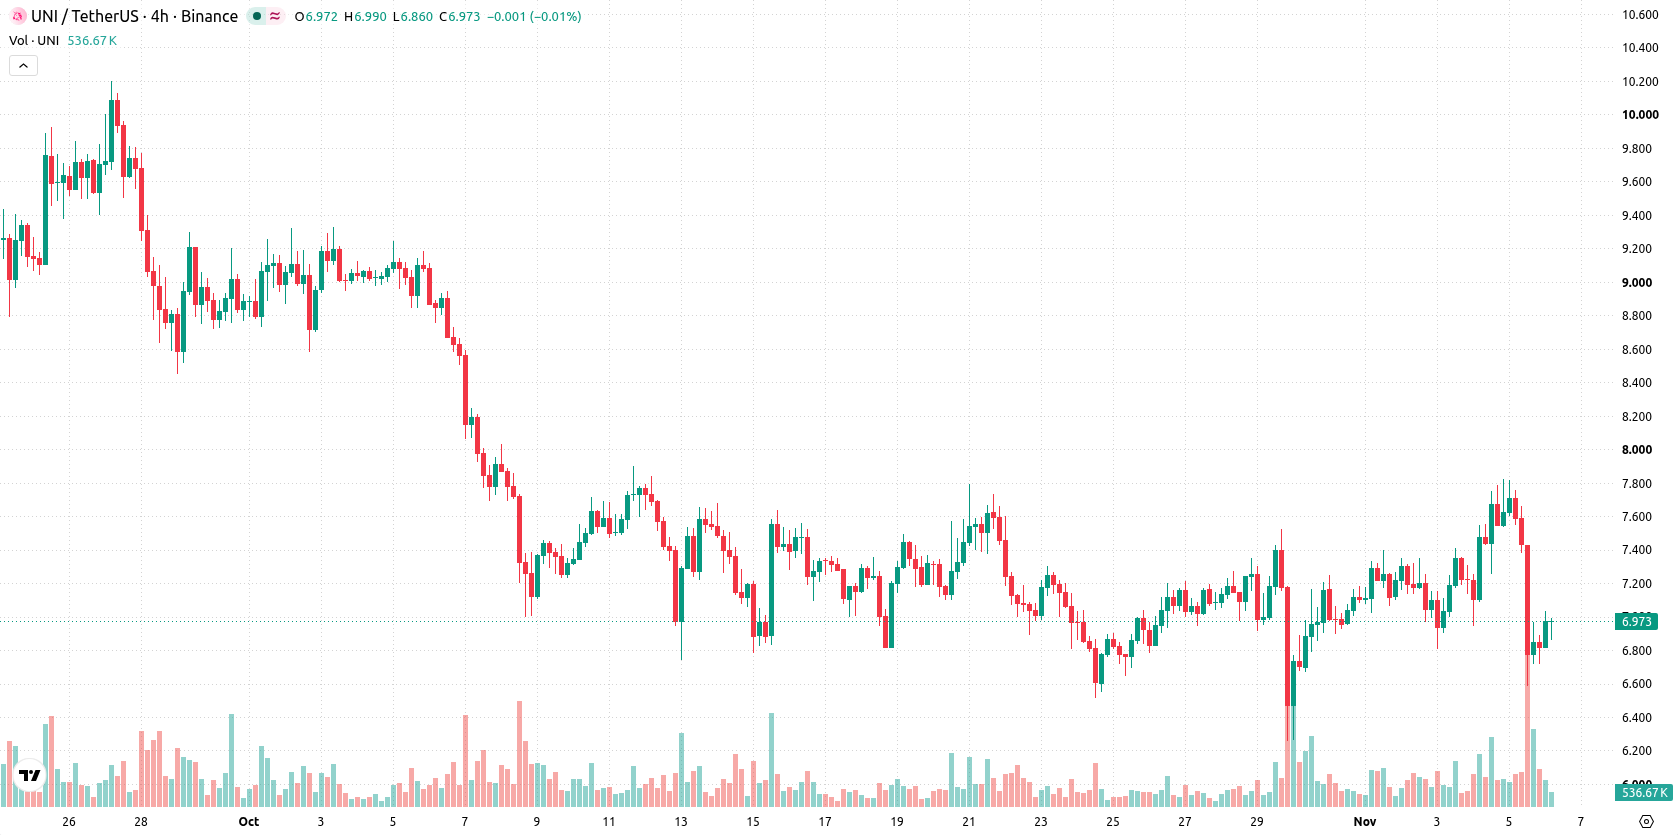
Uniswap (UNI) dropped 9.52% after broader crypto market weakness triggered a selloff, with Bitcoin's decline and sector-wide liquidations driving negative sentiment. The move is supported by sustained selling pressure, as UNI continues to trade beneath its 20-day and 50-day moving averages while short- and medium-term momentum remains weak.
 5.223
7.1600
Highlights
- Uniswap's UNI token faced selling pressure as Bitcoin dropped below $80,000, triggering ETF outflows and broad crypto liquidations.
- The platform saw 13,137 new UNI addresses in one day in late October, its highest daily increase since September 2020, with active addresses at a four-year high.
- UNI trades below short- and medium-term moving averages with technical indicators showing sustained downside momentum and an expected range of $6.3315 to $8.163 over five days.
Network activity surges amid record address growth and persistent sell pressure
Uniswap's UNI token was affected by the recent market downturn attributed to Bitcoin falling below $80,000, ETF outflows, and widespread liquidations of leveraged positions across the crypto sector. Throughout this period, Uniswap recorded 13,137 new UNI addresses in one day in late October, its highest since September 2020, and active addresses reached a four-year high. The decentralized exchange also surpassed $20 billion in cumulative trading volume for tokenized stocks, with upcoming native cross-chain interoperability between Optimism and Uniswap Labs announced for December 15, though price action has remained under broader selling pressure.
Technical momentum weak despite long-term support holding above 200-day average
UNI/USD remains under pressure, trading below its 20-day and 50-day moving averages at $7.1293 and $7.9551. The price stays above the 200-day average at $4.8121, providing a bullish longer-term context. Key levels are set with immediate resistance at $7.031 and support at $6.812. Technical indicators show broadly negative momentum, with both MACD and Average Directional Index indicating persistent selling. Oscillators, including RSI, Stochastic RSI, and CCI, are currently neutral, while Bull/Bear Power reflects some intraday buyer activity and the Awesome Oscillator remains neutral. The price is tracking in the mid-range for the session after opening with a significant downside gap, and intraday volatility is at 3.21%.
Earlier, analysts noted that Uniswap continued to face strong selling momentum despite ongoing protocol development and new compliance features. The current analysis strengthens this view with evidence of persistent downside risk and suggests traders should closely monitor the $6.812 support level for potential further declines.






Latest Uniswap (UNI) News




-
 Afghanistan
-
 Albania
-
 Algeria
-
 Angola
-
 Argentina
-
 Armenia
-
 Australia
-
 Austria
-
 Azerbaijan
-
 Bahamas
-
 Bahrain
-
 Bangladesh
-
 Belarus
-
 Belgium
-
 Bolivia
-
 Botswana
-
 Brazil
-
 Brunei
-
 Bulgaria
-
 Cambodia
-
 Cameroon
-
 Canada
-
 Chile
-
 China
-
 Colombia
-
 Congo
-
 Costa Rica
-
 Cote d'Ivoire
-
 Croatia
-
 Cuba
-
 Cyprus
-
 Czechia
-
 DR Congo
-
 Denmark
-
 Dominican Republic
-
 Ecuador
-
 Egypt
-
 El Salvador
-
 Estonia
-
 Eswatini
-
 Ethiopia
-
 Finland
-
 France
-
 Georgia
-
 Germany
-
 Ghana
-
 Greece
-
 Haiti
-
 Hong Kong
-
 Hungary
-
 India
-
 Indonesia
-
 Iran, Islamic republic
-
 Iraq
-
 Ireland
-
 Israel
-
 Italy
-
 Jamaica
-
 Japan
-
 Jordan
-
 Kazakhstan
-
 Kenya
-
 Korea
-
 Kuwait
-
 Kyrgyzstan
-
 Laos
-
 Latvia
-
 Lebanon
-
 Lesotho
-
 Libya
-
 Lithuania
-
 Luxembourg
-
 Madagascar
-
 Malaysia
-
 Malta
-
 Mauritius
-
 Mexico
-
 Moldova
-
 Mongolia
-
 Montenegro
-
 Morocco
-
 Mozambique
-
 Myanmar
-
 Namibia
-
 Nepal
-
 Netherlands
-
 New Zealand
-
 Nigeria
-
 North Macedonia
-
 Norway
-
 Oman
-
 Pakistan
-
 Palestine
-
 Panama
-
 Papua New Guinea
-
 Paraguay
-
 Peru
-
 Philippines
-
 Poland
-
 Portugal
-
 Puerto Rico
-
 Qatar
-
 Reunion
-
 Romania
-
 Rwanda
-
 Saudi Arabia
-
 Serbia
-
 Singapore
-
 Slovakia
-
 Slovenia
-
 Somalia
-
 South Africa
-
 Spain
-
 Sri Lanka
-
 Sweden
-
 Switzerland
-
 Syria
-
 Taiwan
-
 Tajikistan
-
 Tanzania
-
 Thailand
-
 Trinidad and Tobago
-
 Tunisia
-
 Turkey
-
 UAE
-
 Uganda
-
 Ukraine
-
 United Kingdom
-
United States
-
 Uruguay
-
 Uzbekistan
-
 Venezuela
-
 Vietnam
-
 Yemen
-
 Zambia
-
 Zimbabwe
- Forex
- Crypto












