

Jito technical analysis: Downward trend remains with $0.3242 support in focus

Jito (JTO) is trading at $0.3387, down 7.33% on the day. The asset is positioned above its short-term averages but remains below its medium- and long-term moving averages, highlighting ongoing selling pressure.
 0.2675
0.3290
Highlights
- Jito Labs introduced JTX Equities on Solana, enabling trading of over 1,650 tokenized stocks using a request-for-quote system with trade sizes up to $1 million.
- The platform allocates 80% of fees to recurring Jito token buybacks, directly linking trading activity to increasing token scarcity.
- JTO trades below key moving averages and faces a 74% probability of moving lower, with price projected between $0.3242 to $0.3539 over the next 2 to 3 days.
Token demand potential rises with platform-driven JTO buybacks
Jito Labs launched JTX Equities, a platform enabling the trading of over 1,650 tokenized stocks on Solana via a request-for-quote system, with trades up to $1 million and 80% of platform fees directed to buybacks of the Jito governance token, according to Cryptobriefing and Solanacompass. This structure introduces targeted demand for JTO through recurring buybacks, directly linking platform activity to token scarcity. The rollout also featured direct issuer RFQ access to stocks like Backpack and Ondo, with Ondo Finance integrating its tokenized stock offerings to leverage JTX’s on-chain connections to underlying market liquidity, according to Paragraph, though price action has remained under broader selling pressure.
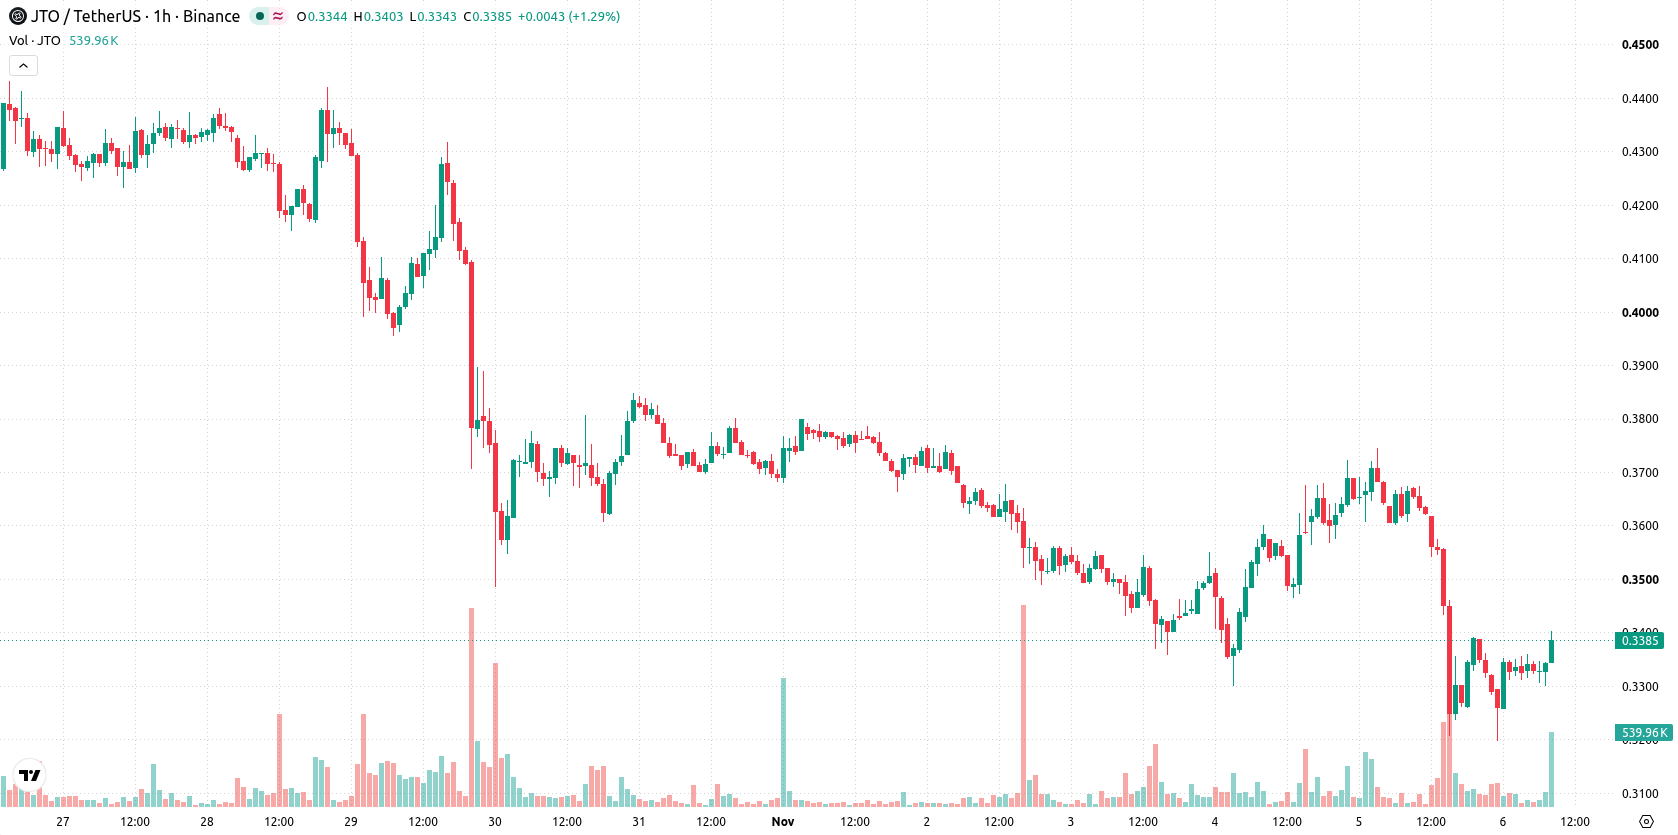
Upside limited as strong sell signals dominate below technical boundaries
JTO/USD has established the Ichimoku Kijun at $0.3435 as immediate resistance, which coincides with the top of the intraday recovery so far. On the downside, technical support is seen near $0.3242, with the recent short-term moving average cross limiting upside momentum below the MA-50 and MA-200 levels. MACD reflects strong sell momentum and ADX confirms a prevailing sell bias, while RSI and CCI are neutral. Stochastic RSI, however, is in the overbought zone, suggesting that the recent rebound could face further downside risk. Bull/Bear Power is mildly negative, and the Awesome Oscillator remains neutral, indicating a lack of trend reinforcement.
Sideways trading seen as breakout probability remains muted
For the next two to three trading days, JTO/USD is expected to fluctuate within a typical volatility band between $0.3242 and $0.3539. The probability of a renewed upward breakout is limited at 26%, while further downward movement to test support near $0.3242 holds a 74% likelihood. A sideways scenario remains the baseline outlook, with more decisive direction likely dependent on either a clear break above the $0.3435 resistance or a close below the $0.3242 support.
Earlier, analysts noted that Jito (JTO) was exhibiting persistent technical weakness and a prevailing downtrend despite platform-level initiatives to support the token. The current setup reinforces this bearish backdrop, with traders advised to monitor the $0.3435 resistance and $0.3242 support as pivotal levels for confirming any shift in near-term direction.






Latest Jito News





-
 Afghanistan
-
 Albania
-
 Algeria
-
 Angola
-
 Argentina
-
 Armenia
-
 Australia
-
 Austria
-
 Azerbaijan
-
 Bahamas
-
 Bahrain
-
 Bangladesh
-
 Belarus
-
 Belgium
-
 Bolivia
-
 Botswana
-
 Brazil
-
 Brunei
-
 Bulgaria
-
 Cambodia
-
 Cameroon
-
 Canada
-
 Chile
-
 China
-
 Colombia
-
 Congo
-
 Costa Rica
-
 Cote d'Ivoire
-
 Croatia
-
 Cuba
-
 Cyprus
-
 Czechia
-
 DR Congo
-
 Denmark
-
 Dominican Republic
-
 Ecuador
-
 Egypt
-
 El Salvador
-
 Estonia
-
 Eswatini
-
 Ethiopia
-
 Finland
-
 France
-
 Georgia
-
 Germany
-
 Ghana
-
 Greece
-
 Haiti
-
 Hong Kong
-
 Hungary
-
 India
-
 Indonesia
-
 Iran, Islamic republic
-
 Iraq
-
 Ireland
-
 Israel
-
 Italy
-
 Jamaica
-
 Japan
-
 Jordan
-
 Kazakhstan
-
 Kenya
-
 Korea
-
 Kuwait
-
 Kyrgyzstan
-
 Laos
-
 Latvia
-
 Lebanon
-
 Lesotho
-
 Libya
-
 Lithuania
-
 Luxembourg
-
 Madagascar
-
 Malaysia
-
 Malta
-
 Mauritius
-
 Mexico
-
 Moldova
-
 Mongolia
-
 Montenegro
-
 Morocco
-
 Mozambique
-
 Myanmar
-
 Namibia
-
 Nepal
-
 Netherlands
-
 New Zealand
-
 Nigeria
-
 North Macedonia
-
 Norway
-
 Oman
-
 Pakistan
-
 Palestine
-
 Panama
-
 Papua New Guinea
-
 Paraguay
-
 Peru
-
 Philippines
-
 Poland
-
 Portugal
-
 Puerto Rico
-
 Qatar
-
 Reunion
-
 Romania
-
 Rwanda
-
 Saudi Arabia
-
 Serbia
-
 Singapore
-
 Slovakia
-
 Slovenia
-
 Somalia
-
 South Africa
-
 Spain
-
 Sri Lanka
-
 Sweden
-
 Switzerland
-
 Syria
-
 Taiwan
-
 Tajikistan
-
 Tanzania
-
 Thailand
-
 Trinidad and Tobago
-
 Tunisia
-
 Turkey
-
 UAE
-
 Uganda
-
 Ukraine
-
 United Kingdom
-
United States
-
 Uruguay
-
 Uzbekistan
-
 Venezuela
-
 Vietnam
-
 Yemen
-
 Zambia
-
 Zimbabwe
- Forex
- Crypto












