

Litecoin faces further downside risk as sell signals dominate chart setup: weekly analysis

Litecoin (LTC) is trading near $53 after sliding nearly 4% over the past week, as oversold technical indicators highlight deep selling pressure. The chart signals a prevailing downtrend, but exhaustion in momentum leaves room for a potential rebound if bearish sentiment eases in the days ahead.
 52.34
57.04
Highlights
- Litecoin trades at $53.03, falling 3.84% over the past week and staying below key moving averages.
- Technical indicators MACD and ADX both signal a bearish trend, though CCI and Stochastic RSI are oversold.
- Price is expected to fluctuate between $52.17 and $57.04 with an 80% probability of further decline toward $45.39.
ETF inflow limitations cap rebound as privacy upgrades draw focus
Institutional and retail flows around spot Litecoin ETFs drew attention this week, while outflows from U.S.-listed funds coincided with broader crypto declines, according to Pluang. The first U.S. spot Litecoin ETF saw cumulative inflows of just $16 million, limiting its ability to drive a sustained rally, as reported by 24/7 Wall St. openPR.com noted recent privacy enhancements for LTC through MimbleWimble Extension Blocks and ongoing Layer 2 smart contract development via the LitVM testnet.
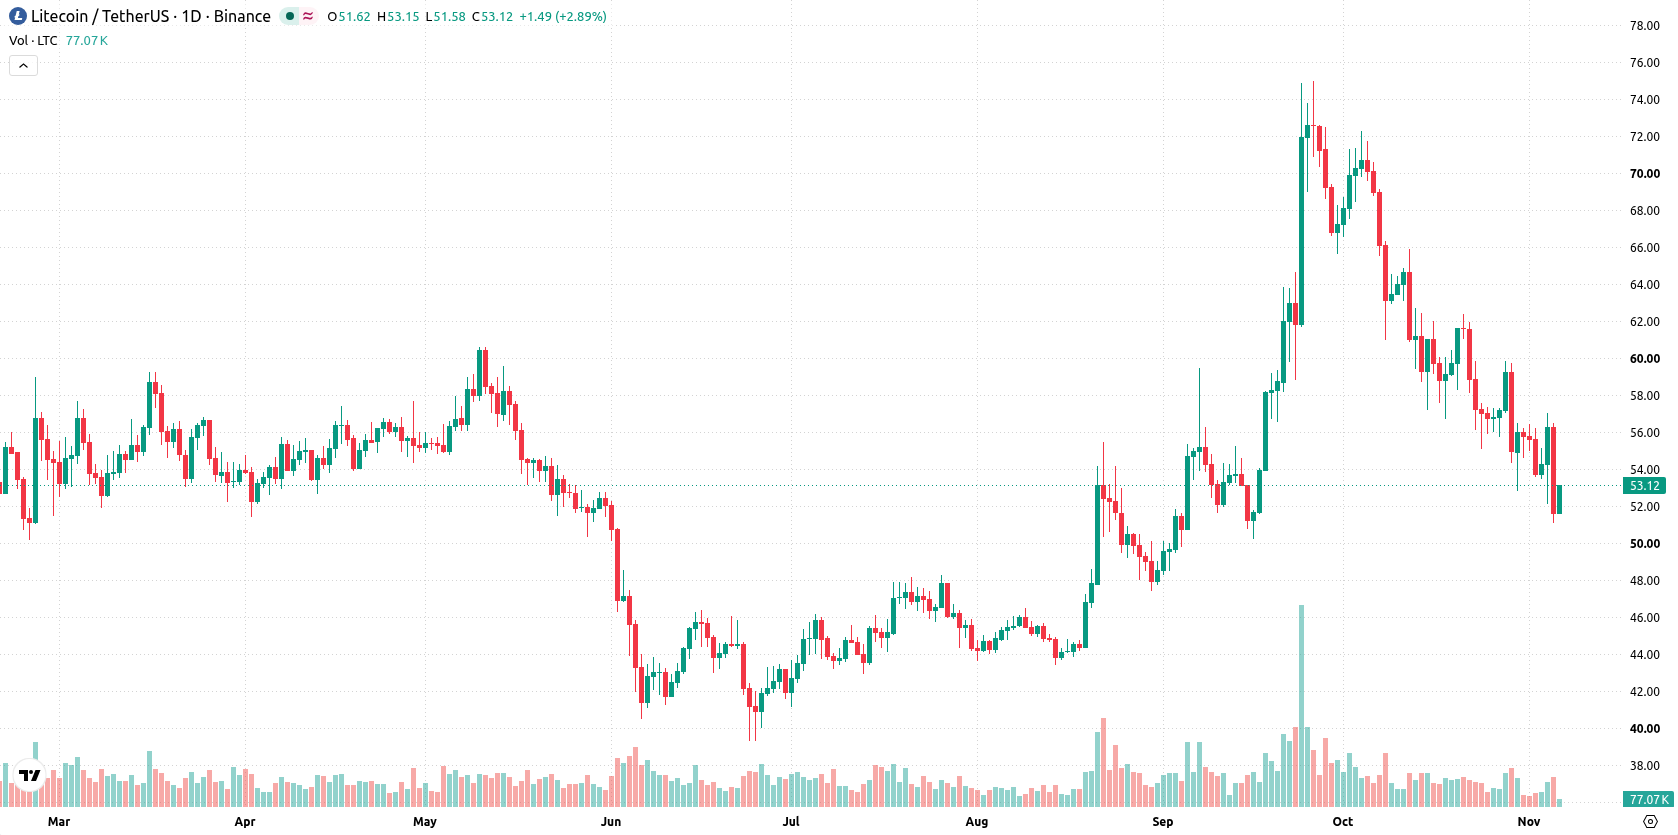
Firm bearish momentum builds as MACD and ADX trigger sell signals
The daily chart shows a sustained move lower with a firm trend, as volatility over the past week stood at 11.69%. MACD and ADX both indicate a sell signal, while CCI and Stochastic RSI are each oversold, suggesting possible selling exhaustion and a chance for near-term rebound. Nearest support is anchored at $52.17, with resistance at $57.04 and the Ichimoku Kijun at $58.61 presenting overhead barriers.
Breakout risk looms as tight range persists in coming week
In the week ahead, the expected range is $45.39 to $56.18. There is a very high probability (more than 80%) of a further drop and a very low probability (less than 20%) of an increase. The base case is for price action to remain contained between support at $52.17 and resistance at $57.04. A clear push above $57.04 would suggest upside potential toward $58.61, while a close below $52.17 would open a deeper move down toward $45.39.
Previously it was reported that Litecoin continued to face broad-based selling pressure with no asset-specific catalysts prompting a strong directional shift. The current analysis reinforces this outlook with fresh confirmation of sustained downside momentum, with traders advised to monitor the $52.17 support level as a breach could signal increased risk of further declines toward $45.39.






Latest Litecoin News





-
 Afghanistan
-
 Albania
-
 Algeria
-
 Angola
-
 Argentina
-
 Armenia
-
 Australia
-
 Austria
-
 Azerbaijan
-
 Bahamas
-
 Bahrain
-
 Bangladesh
-
 Belarus
-
 Belgium
-
 Bolivia
-
 Botswana
-
 Brazil
-
 Brunei
-
 Bulgaria
-
 Cambodia
-
 Cameroon
-
 Canada
-
 Chile
-
 China
-
 Colombia
-
 Congo
-
 Costa Rica
-
 Cote d'Ivoire
-
 Croatia
-
 Cuba
-
 Cyprus
-
 Czechia
-
 DR Congo
-
 Denmark
-
 Dominican Republic
-
 Ecuador
-
 Egypt
-
 El Salvador
-
 Estonia
-
 Eswatini
-
 Ethiopia
-
 Finland
-
 France
-
 Georgia
-
 Germany
-
 Ghana
-
 Greece
-
 Haiti
-
 Hong Kong
-
 Hungary
-
 India
-
 Indonesia
-
 Iran, Islamic republic
-
 Iraq
-
 Ireland
-
 Israel
-
 Italy
-
 Jamaica
-
 Japan
-
 Jordan
-
 Kazakhstan
-
 Kenya
-
 Korea
-
 Kuwait
-
 Kyrgyzstan
-
 Laos
-
 Latvia
-
 Lebanon
-
 Lesotho
-
 Libya
-
 Lithuania
-
 Luxembourg
-
 Madagascar
-
 Malaysia
-
 Malta
-
 Mauritius
-
 Mexico
-
 Moldova
-
 Mongolia
-
 Montenegro
-
 Morocco
-
 Mozambique
-
 Myanmar
-
 Namibia
-
 Nepal
-
 Netherlands
-
 New Zealand
-
 Nigeria
-
 North Macedonia
-
 Norway
-
 Oman
-
 Pakistan
-
 Palestine
-
 Panama
-
 Papua New Guinea
-
 Paraguay
-
 Peru
-
 Philippines
-
 Poland
-
 Portugal
-
 Puerto Rico
-
 Qatar
-
 Reunion
-
 Romania
-
 Rwanda
-
 Saudi Arabia
-
 Serbia
-
 Singapore
-
 Slovakia
-
 Slovenia
-
 Somalia
-
 South Africa
-
 Spain
-
 Sri Lanka
-
 Sweden
-
 Switzerland
-
 Syria
-
 Taiwan
-
 Tajikistan
-
 Tanzania
-
 Thailand
-
 Trinidad and Tobago
-
 Tunisia
-
 Turkey
-
 UAE
-
 Uganda
-
 Ukraine
-
 United Kingdom
-
United States
-
 Uruguay
-
 Uzbekistan
-
 Venezuela
-
 Vietnam
-
 Yemen
-
 Zambia
-
 Zimbabwe
- Forex
- Crypto












