

Sonic rallies amid strong buy signals and overbought market conditions

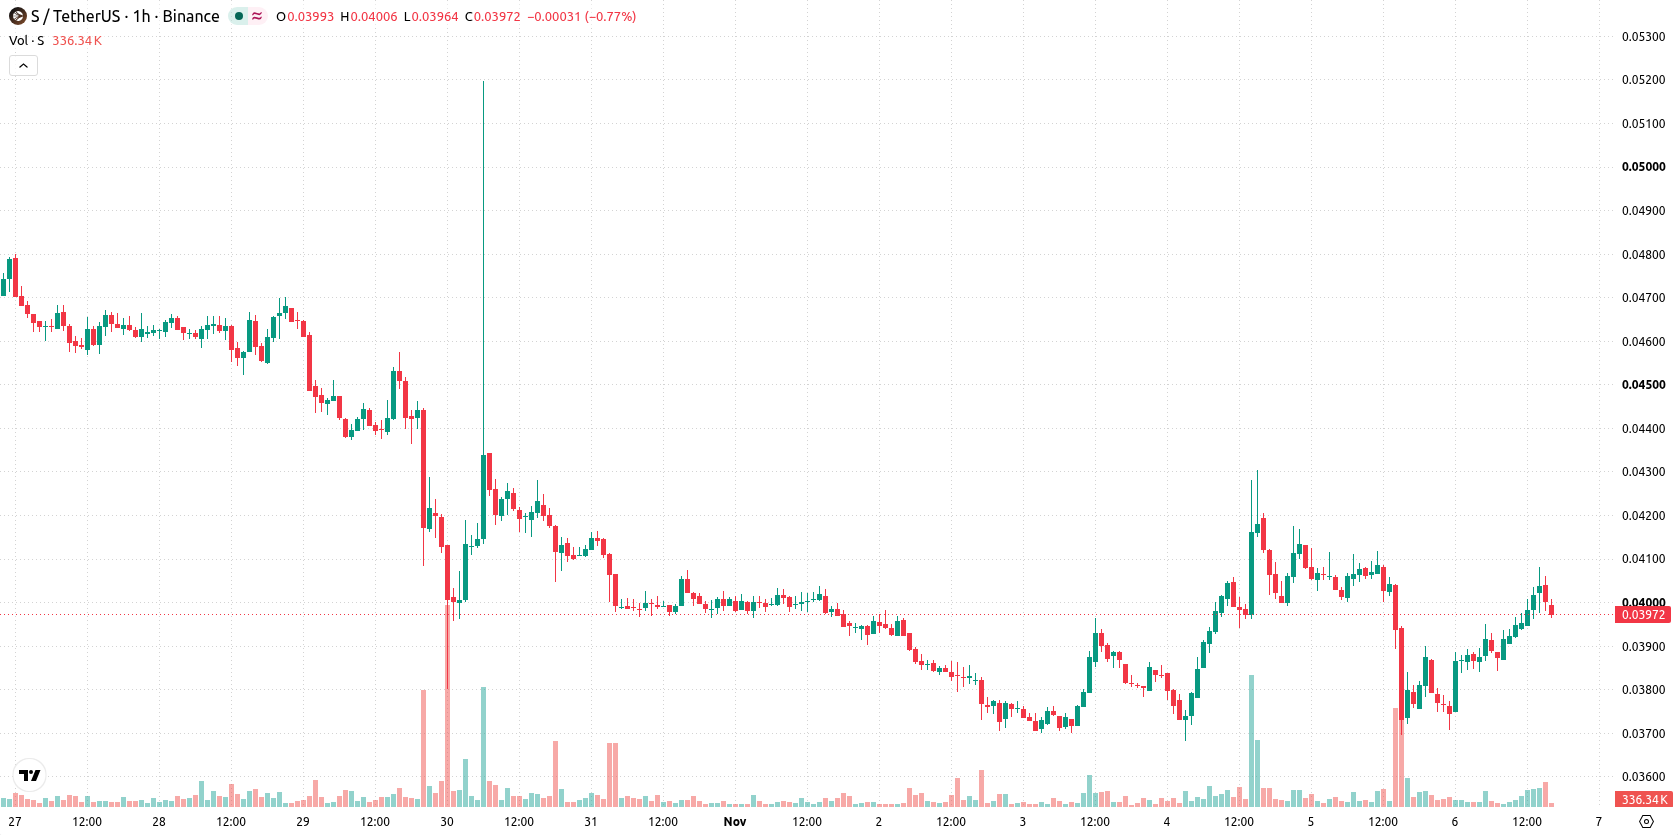
Sonic (S) is trading at $0.0398, up 5.86% on the day, and is currently positioned above its key moving averages.
 0.0362
0.0430
Highlights
- Sonic (S/USD) holds a bullish structure in all timeframes, trading above key moving averages and supported by positive momentum signals.
- Shorter-term oscillators show overbought conditions and divergence, with elevated volatility and potential for a short-term price correction.
- Expected price range in coming days is $0.0295 to $0.0415, with a 78% probability of an upward move and baseline scenario calls for consolidation.
Bullish signals as technical boundaries and momentum diverge
On the hourly chart, S is trading above the MA-20, MA-50, and MA-200 levels. The Ichimoku Kijun sits at $0.0389, serving as immediate support. Momentum indicators remain largely positive, as both MACD and ADX are flashing buy signals. Stochastic RSI and CCI are in overbought territory, while RSI is neutral, highlighting some divergence. Bull/Bear Power is slightly positive, indicating marginal buyer dominance, and the Awesome Oscillator also aligns with the prevailing bullish tone.
Upside dominance as volatility bands define short-term risk
In the near term, the typical volatility band for S is expected between $0.0295 and $0.0415. There is a strong probability of 78% for an upside move, while a downside appears substantially less likely. The primary scenario is for price to consolidate within this range, but a break above resistance could ignite further gains, while a drop below support would shift the scenario bearish.
Earlier, analysts noted that Sonic was facing persistent downside risk and high volatility, with selling pressure dominating the outlook. The current analysis signals a shift toward bullish momentum, making a sustained position above the key moving averages a crucial indicator for potential further gains.










-
 Afghanistan
-
 Albania
-
 Algeria
-
 Angola
-
 Argentina
-
 Armenia
-
 Australia
-
 Austria
-
 Azerbaijan
-
 Bahamas
-
 Bahrain
-
 Bangladesh
-
 Belarus
-
 Belgium
-
 Bolivia
-
 Botswana
-
 Brazil
-
 Brunei
-
 Bulgaria
-
 Cambodia
-
 Cameroon
-
 Canada
-
 Chile
-
 China
-
 Colombia
-
 Congo
-
 Costa Rica
-
 Cote d'Ivoire
-
 Croatia
-
 Cuba
-
 Cyprus
-
 Czechia
-
 DR Congo
-
 Denmark
-
 Dominican Republic
-
 Ecuador
-
 Egypt
-
 El Salvador
-
 Estonia
-
 Eswatini
-
 Ethiopia
-
 Finland
-
 France
-
 Georgia
-
 Germany
-
 Ghana
-
 Greece
-
 Haiti
-
 Hong Kong
-
 Hungary
-
 India
-
 Indonesia
-
 Iran, Islamic republic
-
 Iraq
-
 Ireland
-
 Israel
-
 Italy
-
 Jamaica
-
 Japan
-
 Jordan
-
 Kazakhstan
-
 Kenya
-
 Korea
-
 Kuwait
-
 Kyrgyzstan
-
 Laos
-
 Latvia
-
 Lebanon
-
 Lesotho
-
 Libya
-
 Lithuania
-
 Luxembourg
-
 Madagascar
-
 Malaysia
-
 Malta
-
 Mauritius
-
 Mexico
-
 Moldova
-
 Mongolia
-
 Montenegro
-
 Morocco
-
 Mozambique
-
 Myanmar
-
 Namibia
-
 Nepal
-
 Netherlands
-
 New Zealand
-
 Nigeria
-
 North Macedonia
-
 Norway
-
 Oman
-
 Pakistan
-
 Palestine
-
 Panama
-
 Papua New Guinea
-
 Paraguay
-
 Peru
-
 Philippines
-
 Poland
-
 Portugal
-
 Puerto Rico
-
 Qatar
-
 Reunion
-
 Romania
-
 Rwanda
-
 Saudi Arabia
-
 Serbia
-
 Singapore
-
 Slovakia
-
 Slovenia
-
 Somalia
-
 South Africa
-
 Spain
-
 Sri Lanka
-
 Sweden
-
 Switzerland
-
 Syria
-
 Taiwan
-
 Tajikistan
-
 Tanzania
-
 Thailand
-
 Trinidad and Tobago
-
 Tunisia
-
 Turkey
-
 UAE
-
 Uganda
-
 Ukraine
-
 United Kingdom
-
United States
-
 Uruguay
-
 Uzbekistan
-
 Venezuela
-
 Vietnam
-
 Yemen
-
 Zambia
-
 Zimbabwe
- Forex
- Crypto












