

Sui faces resistance at $0.9314 after 3% weekly drop: weekly analysis

Sui (SUI) is trading near $0.87 after a drop of more than 3% this week, with its chart now reflecting a firm downward trend and technical signals flashing caution. Selling pressure has driven the asset into oversold territory, but a mix of momentum and exhaustion signals means traders are watching for either further declines or a potential short-term rebound this week.
 0.8593
0.9566
Highlights
- Sui trades at $0.8713 after a 3.38% decline, remaining below key medium-term moving averages.
- Technical structure is negative short term with downside momentum and mixed oscillator readings, including oversold signals from the CCI.
- Sui is expected to trade between $0.7446 and $0.938 over the coming week, with a 78% chance of further declines.
Network upgrades and staking expansions offset profit surge for SUI Group Holdings
Sui has just rolled out a new mainnet upgrade aimed at improving network performance for developers, according to OpenPR. Meanwhile, SUI Group Holdings (NASDAQ: SUIG), a major corporate staker of the token, reported a $47.7 million profit in Q3 2026 driven by gains on its digital asset holdings, as noted by FinancialContent. Ongoing ecosystem support, including Coinbase's decision to introduce native SUI staking in July 2026, rounds out recent developments (source: Coinpedia).
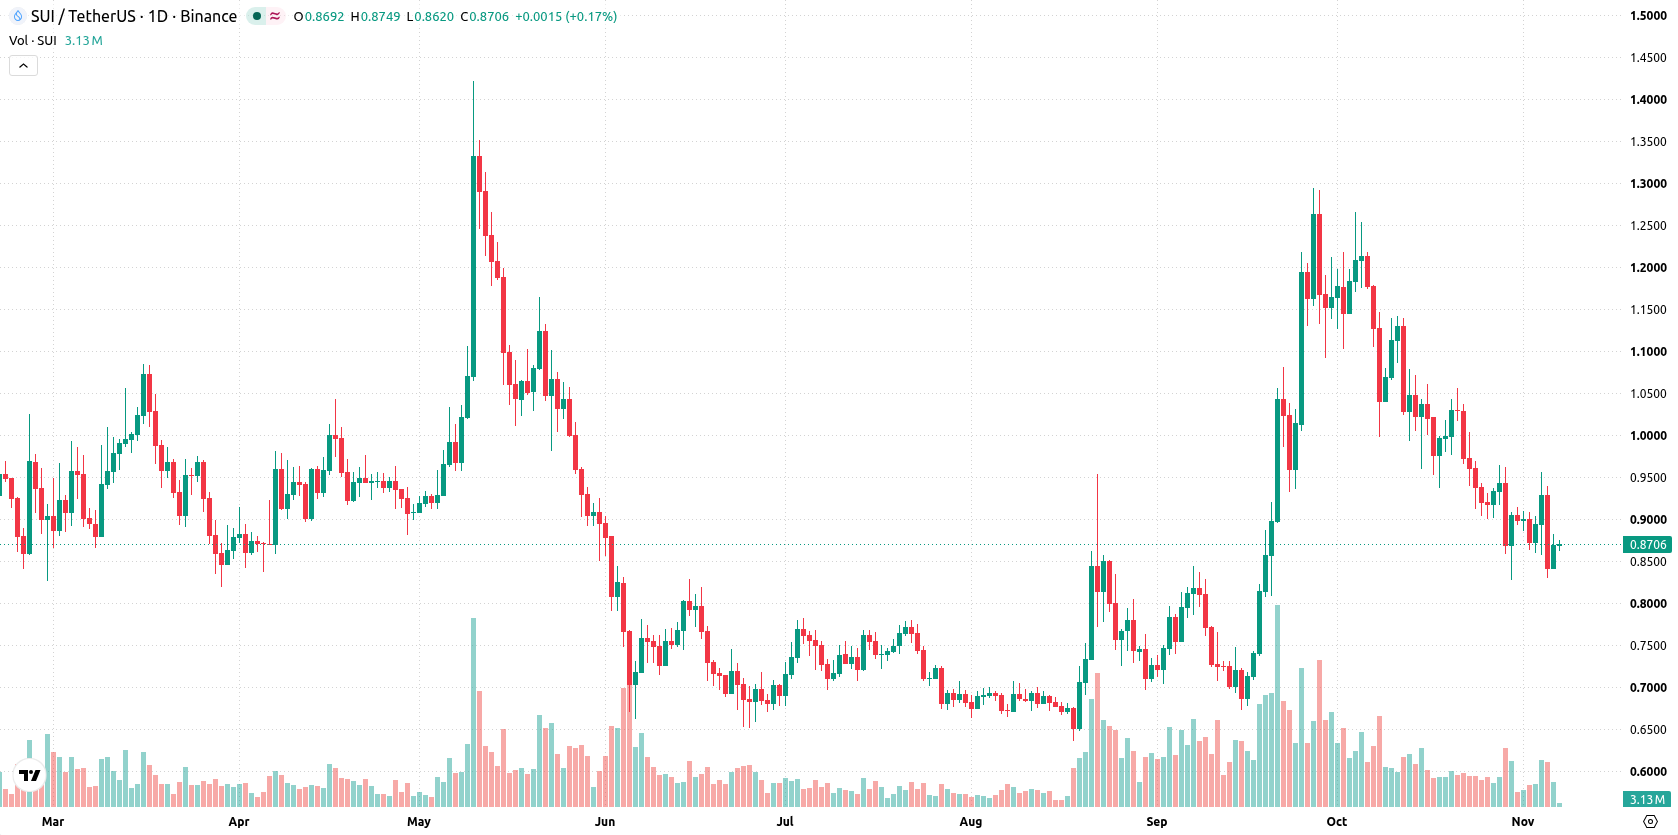
Momentum signals diverge as downside persists and volatility stays high this week
The daily chart shows a sustained move lower with a firm trend, underlined by a MACD Sell signal and ADX at 26.0294, both highlighting downside momentum. Oscillator readings are mixed—RSI and Stoch RSI are neutral, while CCI is the only one indicating an oversold state, which may suggest a potential for selling exhaustion. Volatility over the last 7 days has been elevated at 15.2%. Immediate support lies at $0.8631 (the 200-day), with resistance at $0.9314 (the 20-day), and the Ichimoku Kijun acting as an additional cap at $0.9838.
Bearish bias dominates outlook as breakdown risk outweighs rebound scenarios
Over the coming week, Sui is expected to trade between $0.7446 and $0.938, with a 22% probability of an increase and a 78% chance of a further decrease. The base case is continued trading within this range. A sustained move above $0.9314 would open the door for a bullish rebound toward the Kijun at $0.9838. Alternatively, a break below $0.8631 may accelerate declines toward the lower end of the forecast range.
Earlier, analysts noted that Sui remained under persistent bearish pressure despite occasional indications of demand within its ecosystem. The current technical setup, combined with ongoing ecosystem developments, underscores the importance of monitoring the $0.8631 support level for potential downside breaks in the days ahead.






Latest SUI News




-
 Afghanistan
-
 Albania
-
 Algeria
-
 Angola
-
 Argentina
-
 Armenia
-
 Australia
-
 Austria
-
 Azerbaijan
-
 Bahamas
-
 Bahrain
-
 Bangladesh
-
 Belarus
-
 Belgium
-
 Bolivia
-
 Botswana
-
 Brazil
-
 Brunei
-
 Bulgaria
-
 Cambodia
-
 Cameroon
-
 Canada
-
 Chile
-
 China
-
 Colombia
-
 Congo
-
 Costa Rica
-
 Cote d'Ivoire
-
 Croatia
-
 Cuba
-
 Cyprus
-
 Czechia
-
 DR Congo
-
 Denmark
-
 Dominican Republic
-
 Ecuador
-
 Egypt
-
 El Salvador
-
 Estonia
-
 Eswatini
-
 Ethiopia
-
 Finland
-
 France
-
 Georgia
-
 Germany
-
 Ghana
-
 Greece
-
 Haiti
-
 Hong Kong
-
 Hungary
-
 India
-
 Indonesia
-
 Iran, Islamic republic
-
 Iraq
-
 Ireland
-
 Israel
-
 Italy
-
 Jamaica
-
 Japan
-
 Jordan
-
 Kazakhstan
-
 Kenya
-
 Korea
-
 Kuwait
-
 Kyrgyzstan
-
 Laos
-
 Latvia
-
 Lebanon
-
 Lesotho
-
 Libya
-
 Lithuania
-
 Luxembourg
-
 Madagascar
-
 Malaysia
-
 Malta
-
 Mauritius
-
 Mexico
-
 Moldova
-
 Mongolia
-
 Montenegro
-
 Morocco
-
 Mozambique
-
 Myanmar
-
 Namibia
-
 Nepal
-
 Netherlands
-
 New Zealand
-
 Nigeria
-
 North Macedonia
-
 Norway
-
 Oman
-
 Pakistan
-
 Palestine
-
 Panama
-
 Papua New Guinea
-
 Paraguay
-
 Peru
-
 Philippines
-
 Poland
-
 Portugal
-
 Puerto Rico
-
 Qatar
-
 Reunion
-
 Romania
-
 Rwanda
-
 Saudi Arabia
-
 Serbia
-
 Singapore
-
 Slovakia
-
 Slovenia
-
 Somalia
-
 South Africa
-
 Spain
-
 Sri Lanka
-
 Sweden
-
 Switzerland
-
 Syria
-
 Taiwan
-
 Tajikistan
-
 Tanzania
-
 Thailand
-
 Trinidad and Tobago
-
 Tunisia
-
 Turkey
-
 UAE
-
 Uganda
-
 Ukraine
-
 United Kingdom
-
United States
-
 Uruguay
-
 Uzbekistan
-
 Venezuela
-
 Vietnam
-
 Yemen
-
 Zambia
-
 Zimbabwe
- Forex
- Crypto












