

Curve weekly forecast: Defensive setup holds amid MACD and ADX sell signals

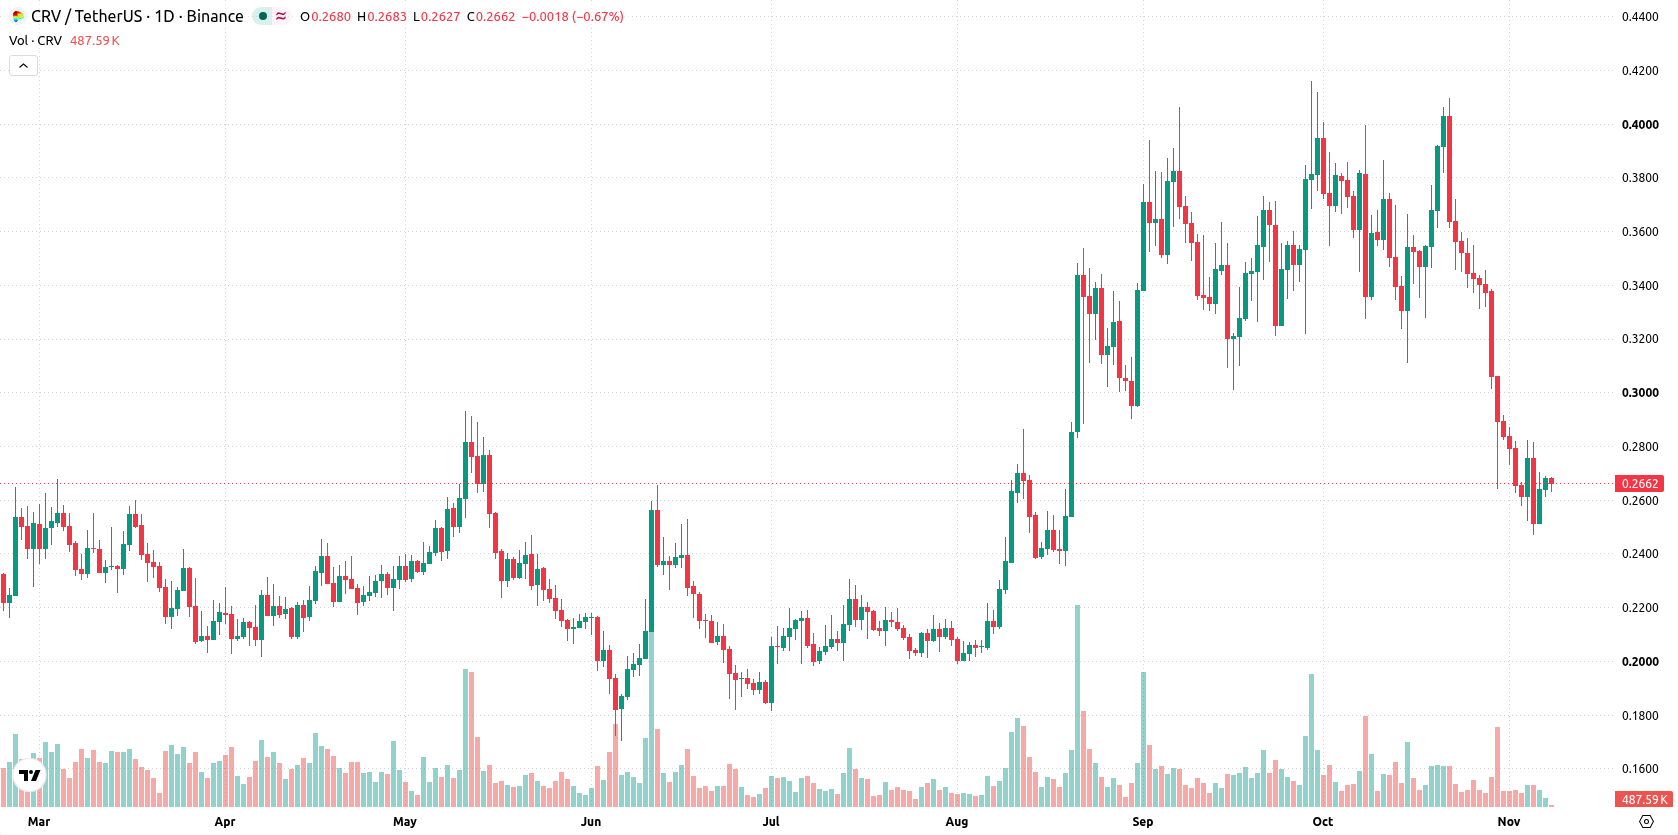
Curve (CRV) is trading near $0.27 after dropping by nearly 7% over the past week, as a defensive setup persists in the market. With sellers in control, participants will be watching to see if downside risk continues or if any shift emerges in the days ahead.
 0.2101
0.2713
Highlights
- Curve trades at $0.2662 after a 6.53% decline over 7 days, remaining below key moving averages.
- Technical indicators confirm a persistent bearish trend with neutral oscillator signals and above-average volatility at 14.3%.
- Curve is projected to trade between $0.2475 and $0.2848 this week, with resistance at $0.2699 and strong downside risk below $0.2469.
Curve expands beyond EVM as Stellar integration boosts cross-chain prospects
Curve Finance has launched its StableSwap exchange on the Stellar mainnet, representing the protocol's first native deployment outside of the Ethereum Virtual Machine ecosystem, according to CoinPaprika. This move involved rebuilding Curve's smart contracts for Stellar's Soroban platform with support from the Stellar Development Foundation. The integration expands Curve’s cross-chain presence and brings new opportunities for liquidity providers via Stellar and LlamaLend.
Sustained bearish momentum this week as MACD, ADX underline downside pressure
The daily picture remains weak, shaped by a sustained move lower with a firm trend, as confirmed by MACD and ADX both showing "sell" direction. Oscillator readings, including an RSI at 35.2276 and a CCI at -83.0314, remain neutral. The 14.3% volatility underlines heightened activity as the price trades between support at $0.2469 and resistance at the MA-200 at $0.2699. The Ichimoku Kijun at $0.3283 reinforces overhead resistance, and the longer-term picture stays negative.
Downside bias persists for next week as resistance caps rebound attempts
Over the coming week, Curve is expected to trade within a $0.2475 to $0.2848 range. There is a very low probability of an increase and a very high probability of a decrease. The base case is continued trading below resistance at $0.2699. A bounce above $0.2699 would challenge the top of the expected range, while a drop below $0.2469 would signal extended downside risk.
Earlier, analysts noted that Curve was under continued downside risk as bearish momentum dominated short-term price action. The current analysis strengthens this outlook, highlighting that the prevailing scenario remains negative and that traders should watch for a potential extended move lower if support at $0.2469 fails to hold.








-
 Afghanistan
-
 Albania
-
 Algeria
-
 Angola
-
 Argentina
-
 Armenia
-
 Australia
-
 Austria
-
 Azerbaijan
-
 Bahamas
-
 Bahrain
-
 Bangladesh
-
 Belarus
-
 Belgium
-
 Bolivia
-
 Botswana
-
 Brazil
-
 Brunei
-
 Bulgaria
-
 Cambodia
-
 Cameroon
-
 Canada
-
 Chile
-
 China
-
 Colombia
-
 Congo
-
 Costa Rica
-
 Cote d'Ivoire
-
 Croatia
-
 Cuba
-
 Cyprus
-
 Czechia
-
 DR Congo
-
 Denmark
-
 Dominican Republic
-
 Ecuador
-
 Egypt
-
 El Salvador
-
 Estonia
-
 Eswatini
-
 Ethiopia
-
 Finland
-
 France
-
 Georgia
-
 Germany
-
 Ghana
-
 Greece
-
 Haiti
-
 Hong Kong
-
 Hungary
-
 India
-
 Indonesia
-
 Iran, Islamic republic
-
 Iraq
-
 Ireland
-
 Israel
-
 Italy
-
 Jamaica
-
 Japan
-
 Jordan
-
 Kazakhstan
-
 Kenya
-
 Korea
-
 Kuwait
-
 Kyrgyzstan
-
 Laos
-
 Latvia
-
 Lebanon
-
 Lesotho
-
 Libya
-
 Lithuania
-
 Luxembourg
-
 Madagascar
-
 Malaysia
-
 Malta
-
 Mauritius
-
 Mexico
-
 Moldova
-
 Mongolia
-
 Montenegro
-
 Morocco
-
 Mozambique
-
 Myanmar
-
 Namibia
-
 Nepal
-
 Netherlands
-
 New Zealand
-
 Nigeria
-
 North Macedonia
-
 Norway
-
 Oman
-
 Pakistan
-
 Palestine
-
 Panama
-
 Papua New Guinea
-
 Paraguay
-
 Peru
-
 Philippines
-
 Poland
-
 Portugal
-
 Puerto Rico
-
 Qatar
-
 Reunion
-
 Romania
-
 Rwanda
-
 Saudi Arabia
-
 Serbia
-
 Singapore
-
 Slovakia
-
 Slovenia
-
 Somalia
-
 South Africa
-
 Spain
-
 Sri Lanka
-
 Sweden
-
 Switzerland
-
 Syria
-
 Taiwan
-
 Tajikistan
-
 Tanzania
-
 Thailand
-
 Trinidad and Tobago
-
 Tunisia
-
 Turkey
-
 UAE
-
 Uganda
-
 Ukraine
-
 United Kingdom
-
United States
-
 Uruguay
-
 Uzbekistan
-
 Venezuela
-
 Vietnam
-
 Yemen
-
 Zambia
-
 Zimbabwe
- Forex
- Crypto












