

Ethereum Glamsterdam hard-fork step delayed: ETH remains range-bound

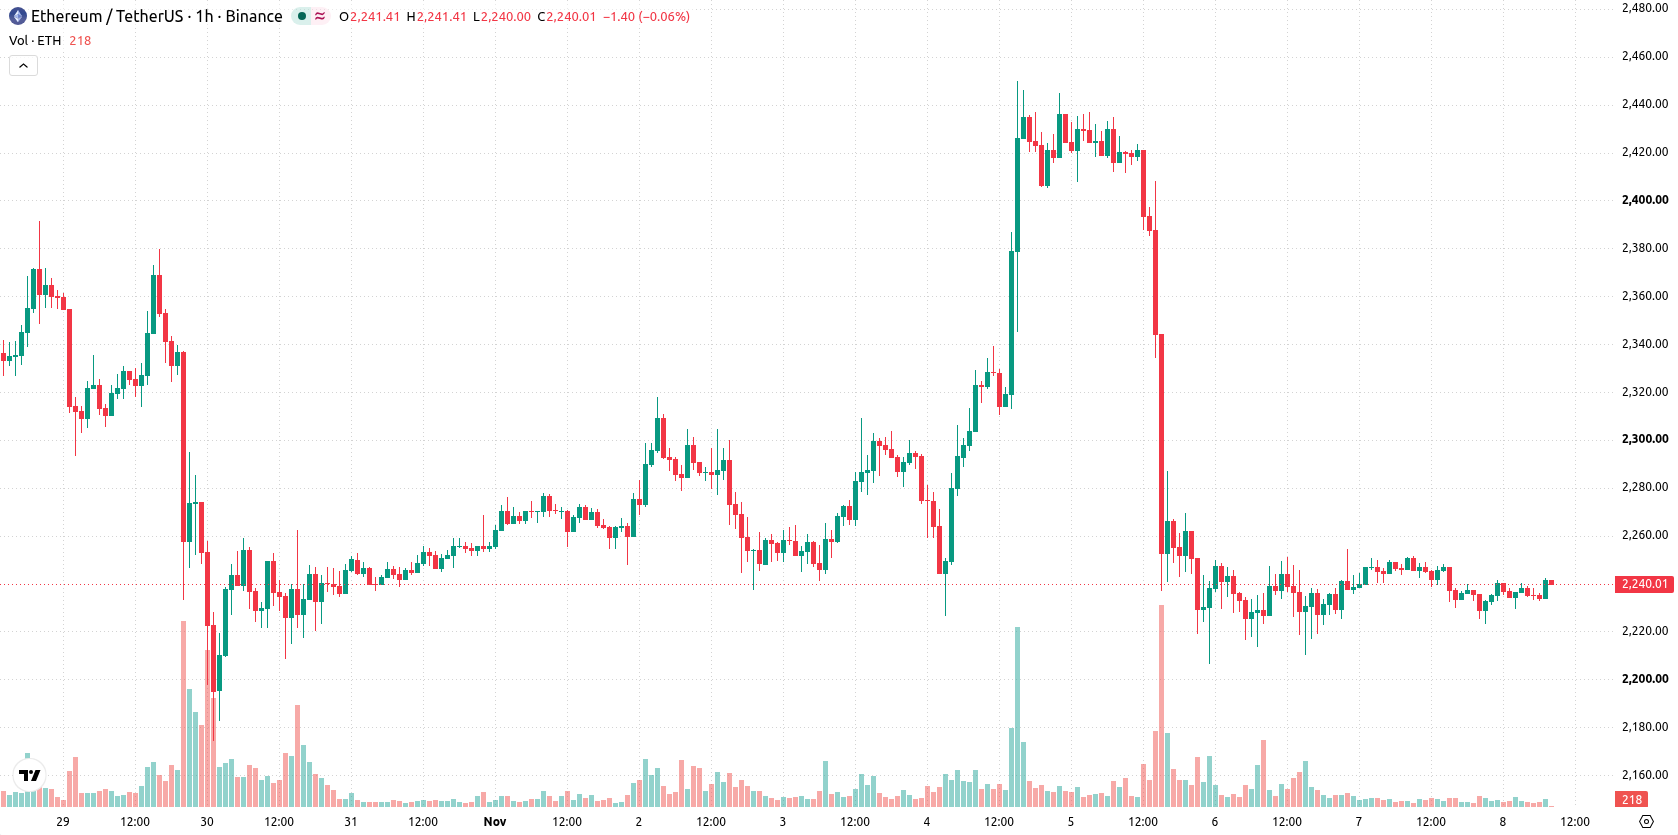
Ethereum (ETH) is trading at $2,241 after a modest pullback in a low-volatility session. The price remains above its key moving averages.
 1936.49
2246.00
Highlights
- Ethereum developers have delayed the next phase of the Glamsterdam hard fork on the Hoodi testnet due to identified compatibility issues in gas-accounting.
- On-chain data showed an ICO-era address acquiring over 2,200 ETH and a separate whale transaction buying nearly 8,800 ETH, with limited immediate impact on sentiment.
- ETH/USD trades in a short- and long-term bullish structure, but technical indicators lean bearish and project continued sideways movement between $2,186 and $2,295 with higher odds of a downward move.
Upgrade delay sparks technical caution amid large holder activity
Ethereum developers have postponed the next Glamsterdam hard-fork step on the Hoodi testnet after researchers identified potential compatibility issues in gas-accounting, according to Newsbtc. This delay clouds the certainty of upgrade timelines, injecting an element of technical caution for developer and investor communities. Meanwhile, on-chain data from Tokenpost showed acquisition of over 2,200 ETH by an initial coin offering-era address in early November, and Chaincatcher reported a separate large whale purchase totaling nearly 8,800 ETH—both highlighting ongoing activity among major holders but having only a muted immediate effect on overall sentiment.
Bearish signals persist as sellers dominate against mixed momentum
On the technical front, ETH/USD trades above its MA-20 and MA-50 on the hourly chart, while maintaining a clear distance above the MA-200 on the daily chart. Immediate support is marked by the Ichimoku Kijun at $2,237. Momentum signals remain mixed: MACD is in strong sell territory and ADX confirms a sell bias, indicating underlying bearish pressure. Oscillators such as RSI, Stoch RSI, and CCI hover in neutral zones, and the Awesome Oscillator is also neutral. Bull/Bear Power registers negatively at -1.87, reflecting ongoing intraday dominance by sellers; a $6.02 negative gap from the prior close suggests mild positioning against recent highs.
Sideways trading likely as downside risk overshadows gains
Over the short term, ETH is likely to remain range-bound, with projected price action set between $2,186 and $2,295—consistent with typical volatility for the current market environment. The probability of upward momentum is assessed as very low, while downside risk is considered elevated, implying limited scope for immediate gains. The baseline scenario is for continued sideways movement within this corridor. A bullish scenario would require ETH to break decisively above resistance, whereas a breach of support at the Ichimoku Kijun could trigger further selling pressure.
Earlier, analysts noted that Ethereum was facing a period of consolidation, characterized by restrained demand and mixed technical signals. The current technical picture continues to support a sideways trading scenario, with traders advised to monitor the $2,237 Ichimoku Kijun as a key level that could determine short-term direction.






Latest Ethereum News





-
 Afghanistan
-
 Albania
-
 Algeria
-
 Angola
-
 Argentina
-
 Armenia
-
 Australia
-
 Austria
-
 Azerbaijan
-
 Bahamas
-
 Bahrain
-
 Bangladesh
-
 Belarus
-
 Belgium
-
 Bolivia
-
 Botswana
-
 Brazil
-
 Brunei
-
 Bulgaria
-
 Cambodia
-
 Cameroon
-
 Canada
-
 Chile
-
 China
-
 Colombia
-
 Congo
-
 Costa Rica
-
 Cote d'Ivoire
-
 Croatia
-
 Cuba
-
 Cyprus
-
 Czechia
-
 DR Congo
-
 Denmark
-
 Dominican Republic
-
 Ecuador
-
 Egypt
-
 El Salvador
-
 Estonia
-
 Eswatini
-
 Ethiopia
-
 Finland
-
 France
-
 Georgia
-
 Germany
-
 Ghana
-
 Greece
-
 Haiti
-
 Hong Kong
-
 Hungary
-
 India
-
 Indonesia
-
 Iran, Islamic republic
-
 Iraq
-
 Ireland
-
 Israel
-
 Italy
-
 Jamaica
-
 Japan
-
 Jordan
-
 Kazakhstan
-
 Kenya
-
 Korea
-
 Kuwait
-
 Kyrgyzstan
-
 Laos
-
 Latvia
-
 Lebanon
-
 Lesotho
-
 Libya
-
 Lithuania
-
 Luxembourg
-
 Madagascar
-
 Malaysia
-
 Malta
-
 Mauritius
-
 Mexico
-
 Moldova
-
 Mongolia
-
 Montenegro
-
 Morocco
-
 Mozambique
-
 Myanmar
-
 Namibia
-
 Nepal
-
 Netherlands
-
 New Zealand
-
 Nigeria
-
 North Macedonia
-
 Norway
-
 Oman
-
 Pakistan
-
 Palestine
-
 Panama
-
 Papua New Guinea
-
 Paraguay
-
 Peru
-
 Philippines
-
 Poland
-
 Portugal
-
 Puerto Rico
-
 Qatar
-
 Reunion
-
 Romania
-
 Rwanda
-
 Saudi Arabia
-
 Serbia
-
 Singapore
-
 Slovakia
-
 Slovenia
-
 Somalia
-
 South Africa
-
 Spain
-
 Sri Lanka
-
 Sweden
-
 Switzerland
-
 Syria
-
 Taiwan
-
 Tajikistan
-
 Tanzania
-
 Thailand
-
 Trinidad and Tobago
-
 Tunisia
-
 Turkey
-
 UAE
-
 Uganda
-
 Ukraine
-
 United Kingdom
-
United States
-
 Uruguay
-
 Uzbekistan
-
 Venezuela
-
 Vietnam
-
 Yemen
-
 Zambia
-
 Zimbabwe
- Forex
- Crypto












