

Will Celestia avoid deeper losses amid heavy downside risk?

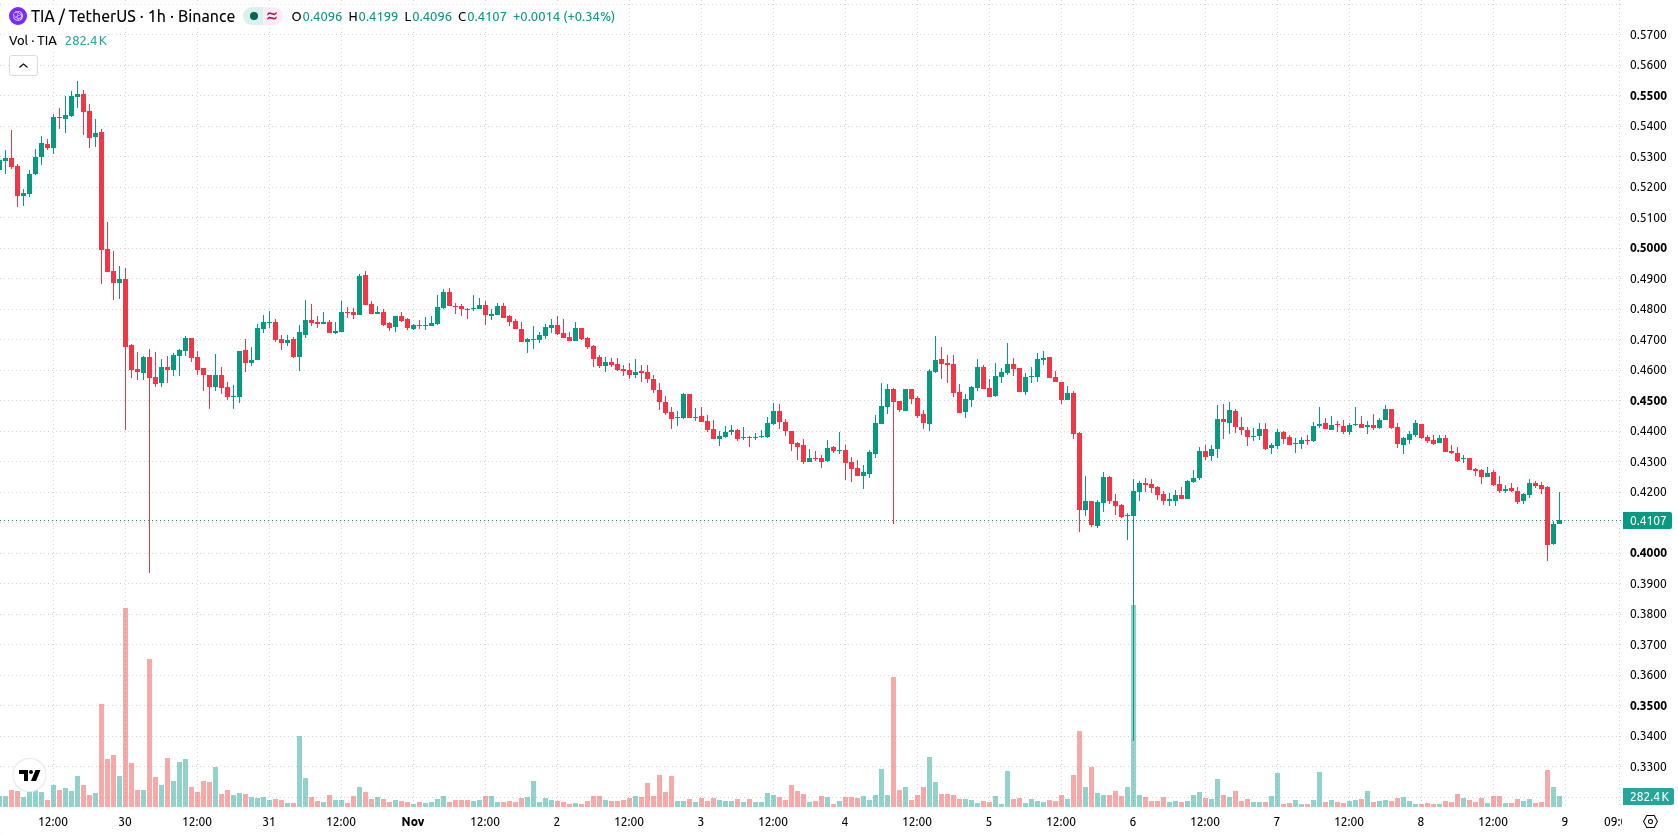
Celestia (TIA) is trading at $0.4112, down 7.07% on the day. The asset is positioned below its key short- and medium-term moving averages, though it remains above its longer-term trends.
 0.4238
0.4711
Highlights
- TIA/USD trades below short and medium-term moving averages, confirming ongoing seller dominance and short-term weakness.
- Bearish momentum persists, with oscillator signals oversold, indicating increased risk of a short-term rebound or selling exhaustion.
- Expected 2 to 3 day price range is $0.38 to $0.4424, with very high probability of a downward move below immediate resistance.
Technical weakness intensifies as sellers dominate momentum
On the hourly chart, TIA/USD was quoted below MA-20 at $0.4234 and MA-50 at $0.4331, while remaining above the longer-term MA-200 at $0.4034. The Ichimoku Kijun at $0.4205 served as immediate resistance. Momentum readings showed both MACD and ADX in Sell mode, while RSI and CCI were verified as oversold, hinting at stretched downside. Stoch RSI was neutral. Bull/Bear Power printed negative at -0.0083, indicating sellers’ control intraday, and the Awesome Oscillator confirmed ongoing weakness. The market remained near the daily low with elevated volatility.
Downside risk prevails as volatility band constrains rebound
TIA is likely to consolidate within a $0.38 to $0.4424 volatility band over the next 2–3 trading days. Downside risk is elevated, with a break below $0.38 pointing to further losses as the high probability outcome, while odds of an upward move are low unless buyers reclaim resistance at $0.4205.
Earlier, analysts noted a shift toward bullish momentum for Celestia following a period of downside pressure. The current market environment, however, signals a reversal as technicals point to heightened downside risk, making the $0.38 support level a critical threshold for traders to watch in the coming sessions.






Latest Celestia News




-
 Afghanistan
-
 Albania
-
 Algeria
-
 Angola
-
 Argentina
-
 Armenia
-
 Australia
-
 Austria
-
 Azerbaijan
-
 Bahamas
-
 Bahrain
-
 Bangladesh
-
 Belarus
-
 Belgium
-
 Bolivia
-
 Botswana
-
 Brazil
-
 Brunei
-
 Bulgaria
-
 Cambodia
-
 Cameroon
-
 Canada
-
 Chile
-
 China
-
 Colombia
-
 Congo
-
 Costa Rica
-
 Cote d'Ivoire
-
 Croatia
-
 Cuba
-
 Cyprus
-
 Czechia
-
 DR Congo
-
 Denmark
-
 Dominican Republic
-
 Ecuador
-
 Egypt
-
 El Salvador
-
 Estonia
-
 Eswatini
-
 Ethiopia
-
 Finland
-
 France
-
 Georgia
-
 Germany
-
 Ghana
-
 Greece
-
 Haiti
-
 Hong Kong
-
 Hungary
-
 India
-
 Indonesia
-
 Iran, Islamic republic
-
 Iraq
-
 Ireland
-
 Israel
-
 Italy
-
 Jamaica
-
 Japan
-
 Jordan
-
 Kazakhstan
-
 Kenya
-
 Korea
-
 Kuwait
-
 Kyrgyzstan
-
 Laos
-
 Latvia
-
 Lebanon
-
 Lesotho
-
 Libya
-
 Lithuania
-
 Luxembourg
-
 Madagascar
-
 Malaysia
-
 Malta
-
 Mauritius
-
 Mexico
-
 Moldova
-
 Mongolia
-
 Montenegro
-
 Morocco
-
 Mozambique
-
 Myanmar
-
 Namibia
-
 Nepal
-
 Netherlands
-
 New Zealand
-
 Nigeria
-
 North Macedonia
-
 Norway
-
 Oman
-
 Pakistan
-
 Palestine
-
 Panama
-
 Papua New Guinea
-
 Paraguay
-
 Peru
-
 Philippines
-
 Poland
-
 Portugal
-
 Puerto Rico
-
 Qatar
-
 Reunion
-
 Romania
-
 Rwanda
-
 Saudi Arabia
-
 Serbia
-
 Singapore
-
 Slovakia
-
 Slovenia
-
 Somalia
-
 South Africa
-
 Spain
-
 Sri Lanka
-
 Sweden
-
 Switzerland
-
 Syria
-
 Taiwan
-
 Tajikistan
-
 Tanzania
-
 Thailand
-
 Trinidad and Tobago
-
 Tunisia
-
 Turkey
-
 UAE
-
 Uganda
-
 Ukraine
-
 United Kingdom
-
United States
-
 Uruguay
-
 Uzbekistan
-
 Venezuela
-
 Vietnam
-
 Yemen
-
 Zambia
-
 Zimbabwe
- Forex
- Crypto












