


SPX6900 (SPX) climbed 11.36% as a surge in trading activity drew buyers into the market, even as recent sessions lacked any confirmed fundamental catalyst or protocol activity to justify the move. The rally looks limited, with SPX still trading below key medium and long-term moving averages.
 0.3142
0.3844
Highlights
- SPX6900 trading volume increased sharply on November 10 and November 11, 2026, with no confirmed catalyst or regulatory event reported.
- The asset's price remains below key moving averages, with market capitalization near $346.95 million and no notable on-chain activity.
- Technical signals show short-term buying strength within bearish trend bias, with a 5-day expected range of $0.3361 to $0.4121 and 68% probability of a downward move.
Trading volume surge as price defies absence of catalysts
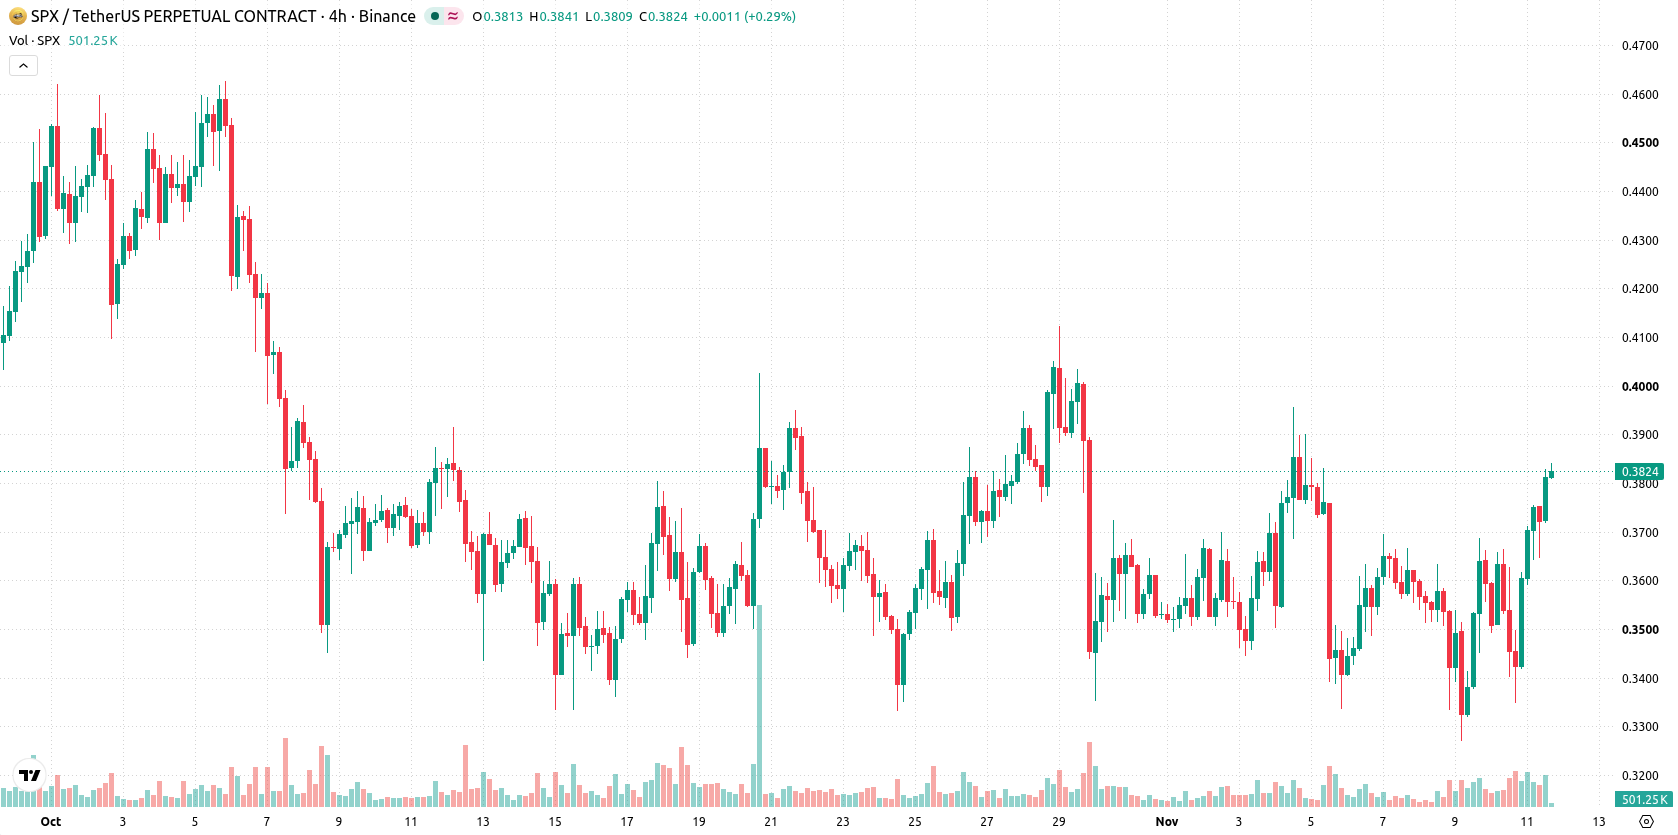
SPX6900, a crypto asset, saw a significant increase in trading volume on November 10 and November 11, 2026. Despite the higher activity, the price remained below multiple key moving averages, and there were no confirmed catalysts, regulatory developments, or evidence of on-chain activity to account for the rise. The asset's market capitalization stood near $346.95 million USD amid the unverified price action.
Short-term bullish bias as momentum remains mixed below key averages
SPX is trading above its 20-day moving average at $0.3615, but remains below both the 50-day at $0.3883 and 200-day at $0.39. This signals short-term bullish momentum within a broader bearish medium and long-term trend. The nearest resistance level is at $0.385, and immediate support is found at $0.3797. Momentum indicators are mixed: MACD reflects strong negative momentum, ADX shows a lack of clear trend strength, while RSI and Stochastic RSI are neutral. The Commodity Channel Index (CCI) reads as oversold, and Bull/Bear Power (BBP) suggests buyers have a marginal intraday edge. The price is near the session high, with intraday volatility measured at 5.65%.
Earlier, analysts noted that SPX6900 was exhibiting short-term bullish momentum amid longer-term technical resistance, with a potential for a trend shift if key levels were breached. The recent surge in trading activity, despite a lack of fundamental catalysts, adds uncertainty to the outlook, making the $0.385 resistance level pivotal for any sustained directional move in the coming days.










-
 Afghanistan
-
 Albania
-
 Algeria
-
 Angola
-
 Argentina
-
 Armenia
-
 Australia
-
 Austria
-
 Azerbaijan
-
 Bahamas
-
 Bahrain
-
 Bangladesh
-
 Belarus
-
 Belgium
-
 Bolivia
-
 Botswana
-
 Brazil
-
 Brunei
-
 Bulgaria
-
 Cambodia
-
 Cameroon
-
 Canada
-
 Chile
-
 China
-
 Colombia
-
 Congo
-
 Costa Rica
-
 Cote d'Ivoire
-
 Croatia
-
 Cuba
-
 Cyprus
-
 Czechia
-
 DR Congo
-
 Denmark
-
 Dominican Republic
-
 Ecuador
-
 Egypt
-
 El Salvador
-
 Estonia
-
 Eswatini
-
 Ethiopia
-
 Finland
-
 France
-
 Georgia
-
 Germany
-
 Ghana
-
 Greece
-
 Haiti
-
 Hong Kong
-
 Hungary
-
 India
-
 Indonesia
-
 Iran, Islamic republic
-
 Iraq
-
 Ireland
-
 Israel
-
 Italy
-
 Jamaica
-
 Japan
-
 Jordan
-
 Kazakhstan
-
 Kenya
-
 Korea
-
 Kuwait
-
 Kyrgyzstan
-
 Laos
-
 Latvia
-
 Lebanon
-
 Lesotho
-
 Libya
-
 Lithuania
-
 Luxembourg
-
 Madagascar
-
 Malaysia
-
 Malta
-
 Mauritius
-
 Mexico
-
 Moldova
-
 Mongolia
-
 Montenegro
-
 Morocco
-
 Mozambique
-
 Myanmar
-
 Namibia
-
 Nepal
-
 Netherlands
-
 New Zealand
-
 Nigeria
-
 North Macedonia
-
 Norway
-
 Oman
-
 Pakistan
-
 Palestine
-
 Panama
-
 Papua New Guinea
-
 Paraguay
-
 Peru
-
 Philippines
-
 Poland
-
 Portugal
-
 Puerto Rico
-
 Qatar
-
 Reunion
-
 Romania
-
 Rwanda
-
 Saudi Arabia
-
 Serbia
-
 Singapore
-
 Slovakia
-
 Slovenia
-
 Somalia
-
 South Africa
-
 Spain
-
 Sri Lanka
-
 Sweden
-
 Switzerland
-
 Syria
-
 Taiwan
-
 Tajikistan
-
 Tanzania
-
 Thailand
-
 Trinidad and Tobago
-
 Tunisia
-
 Turkey
-
 UAE
-
 Uganda
-
 Ukraine
-
 United Kingdom
-
United States
-
 Uruguay
-
 Uzbekistan
-
 Venezuela
-
 Vietnam
-
 Yemen
-
 Zambia
-
 Zimbabwe
- Forex
- Crypto












