

Polkadot weekly outlook: Supply constraints mount as emissions reduction and hard cap take effect

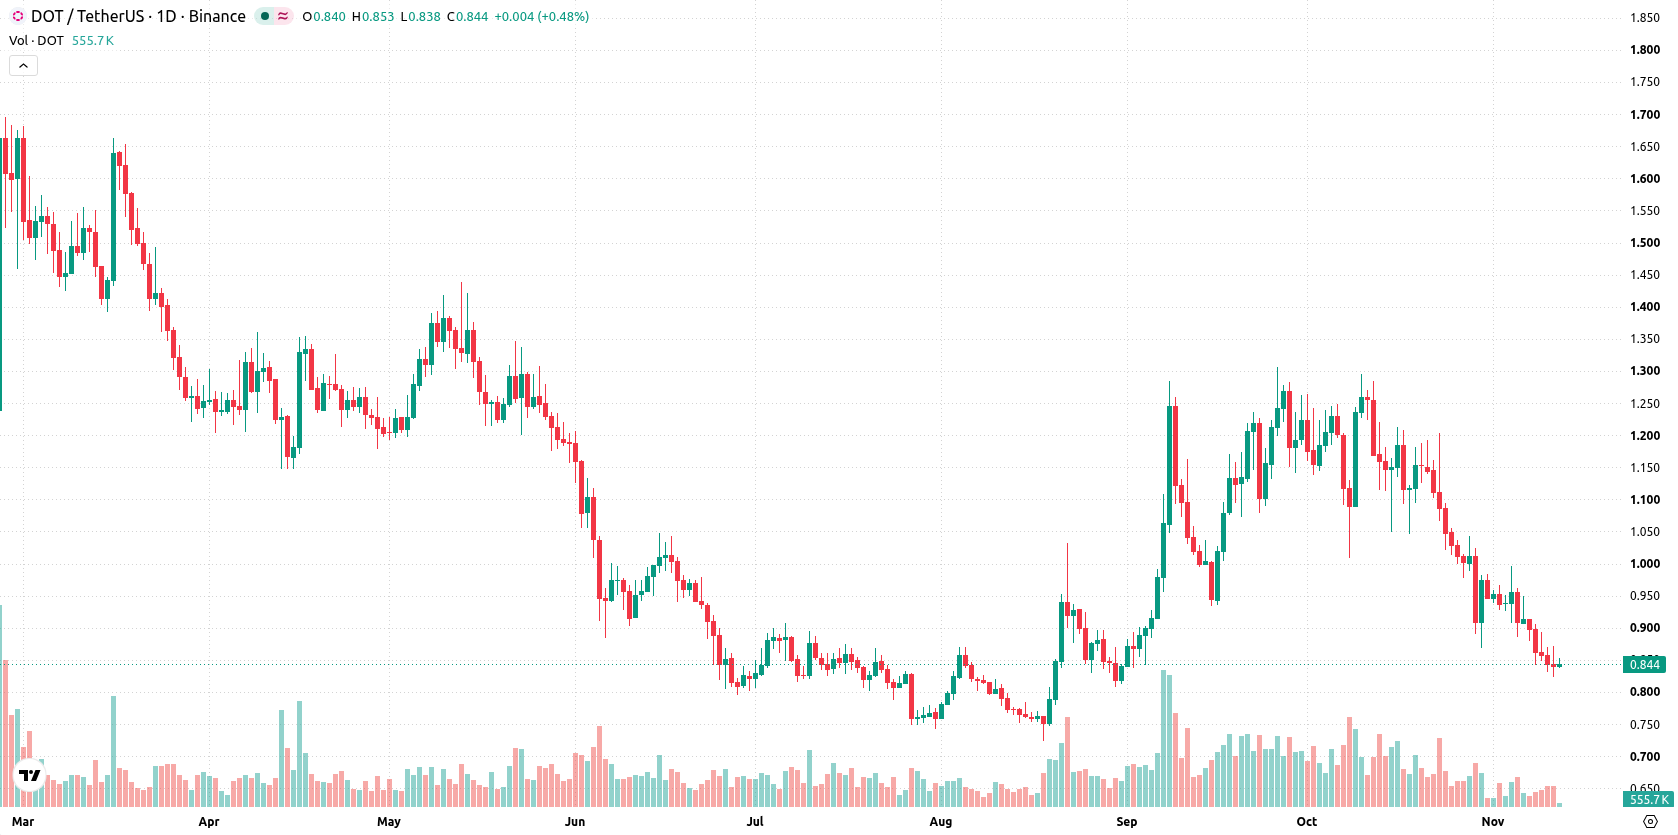
Polkadot (DOT) has plunged to near $0.84 after falling more than 10% this week, as regulatory changes and persistent supply constraints remain in focus. Continued network upgrades and procedural reforms define the landscape, leaving traders to watch how these structural shifts will shape sentiment in the week ahead.
 0.737
0.872
Highlights
- Polkadot trades at $0.843 after falling 10.89% over the past 7 days, showing sustained weakness.
- The asset remains below key moving averages, with MACD and ADX confirming strong downside momentum.
- Expected trading range for the coming week is $0.674 to $0.909, with support at $0.824 and resistance at $0.947.
Protocol reforms and ETF stagnation shape flows amid ongoing supply cutbacks
Polkadot recently implemented several important protocol changes, with Referendum 1966 reducing the active validator count from 600 to 500, according to TokenPost. The parachain slot auction model has been replaced by Agile Coretime, which introduces a flexible slot rental system, as covered by CoinPaprika. Additionally, the 21Shares Polkadot ETF (TDOT) reported no net flows over the past 19 days, and Polkadot's full DOT supply hard cap and emissions reduction are now active, leading to ongoing supply constraints.
Bearish momentum persists this week as technical signals confirm selling fatigue risks
The daily chart displays a sustained move lower with a firm trend, confirmed by the MACD and ADX both signaling further downside and high conviction behind the current trend. Oscillator readings are largely neutral apart from the CCI, which sits in its oversold zone at -126.581, suggesting the potential for selling exhaustion. Volatility is elevated with a 7-day reading at 15.17%. Immediate support is at $0.824 with resistance at $0.947, while the Kijun at $1.017 acts as an additional ceiling.
Further downside expected next week unless resistance is breached
Over the coming week, the expected range is $0.674 to $0.909, with a very high probability of a further decline (more than 80%) and a very low probability of a rebound (less than 20%). The base case is for consolidation or further declines within this range. A move above $0.947 would be required to suggest a near-term recovery, while a break below $0.824 would open the way for deeper losses toward the lower boundary of the expected range.
Earlier, analysts noted that Polkadot was under persistent downside pressure amid technical risks and unresolved security vulnerabilities. The latest developments—highlighted by ongoing protocol reforms and continued price weakness—reinforce the prevailing bearish scenario, making a sustained move above $0.947 a key trigger to monitor for any signs of near-term recovery.










-
 Afghanistan
-
 Albania
-
 Algeria
-
 Angola
-
 Argentina
-
 Armenia
-
 Australia
-
 Austria
-
 Azerbaijan
-
 Bahamas
-
 Bahrain
-
 Bangladesh
-
 Belarus
-
 Belgium
-
 Bolivia
-
 Botswana
-
 Brazil
-
 Brunei
-
 Bulgaria
-
 Cambodia
-
 Cameroon
-
 Canada
-
 Chile
-
 China
-
 Colombia
-
 Congo
-
 Costa Rica
-
 Cote d'Ivoire
-
 Croatia
-
 Cuba
-
 Cyprus
-
 Czechia
-
 DR Congo
-
 Denmark
-
 Dominican Republic
-
 Ecuador
-
 Egypt
-
 El Salvador
-
 Estonia
-
 Eswatini
-
 Ethiopia
-
 Finland
-
 France
-
 Georgia
-
 Germany
-
 Ghana
-
 Greece
-
 Haiti
-
 Hong Kong
-
 Hungary
-
 India
-
 Indonesia
-
 Iran, Islamic republic
-
 Iraq
-
 Ireland
-
 Israel
-
 Italy
-
 Jamaica
-
 Japan
-
 Jordan
-
 Kazakhstan
-
 Kenya
-
 Korea
-
 Kuwait
-
 Kyrgyzstan
-
 Laos
-
 Latvia
-
 Lebanon
-
 Lesotho
-
 Libya
-
 Lithuania
-
 Luxembourg
-
 Madagascar
-
 Malaysia
-
 Malta
-
 Mauritius
-
 Mexico
-
 Moldova
-
 Mongolia
-
 Montenegro
-
 Morocco
-
 Mozambique
-
 Myanmar
-
 Namibia
-
 Nepal
-
 Netherlands
-
 New Zealand
-
 Nigeria
-
 North Macedonia
-
 Norway
-
 Oman
-
 Pakistan
-
 Palestine
-
 Panama
-
 Papua New Guinea
-
 Paraguay
-
 Peru
-
 Philippines
-
 Poland
-
 Portugal
-
 Puerto Rico
-
 Qatar
-
 Reunion
-
 Romania
-
 Rwanda
-
 Saudi Arabia
-
 Serbia
-
 Singapore
-
 Slovakia
-
 Slovenia
-
 Somalia
-
 South Africa
-
 Spain
-
 Sri Lanka
-
 Sweden
-
 Switzerland
-
 Syria
-
 Taiwan
-
 Tajikistan
-
 Tanzania
-
 Thailand
-
 Trinidad and Tobago
-
 Tunisia
-
 Turkey
-
 UAE
-
 Uganda
-
 Ukraine
-
 United Kingdom
-
United States
-
 Uruguay
-
 Uzbekistan
-
 Venezuela
-
 Vietnam
-
 Yemen
-
 Zambia
-
 Zimbabwe
- Forex
- Crypto












