

Ethereum sees ETF outflows and Foundation sales: ETH remains under pressure

Ethereum (ETH) is trading at $1,906, showing a marginal decline on the day with price action remaining below its key moving averages. The asset is currently exhibiting heightened volatility amid an actively traded but downward-biased session.
 1936.49
2246.00
Highlights
- US spot Ethereum ETFs saw major outflows and nearly $250 million in liquidations, exerting downward pressure on ETH.
- Ethereum Foundation-linked wallets sold 4,000 ETH in November, while staking participation reached a record 36.3% with 44.5 million ETH locked.
- ETH/USD trades under key moving averages with negative momentum signals, expected to range from $1,741 to $1,984 over the next days.
ETF outflows and developer delays increase selling as staking peaks
Significant outflows from US spot Ethereum ETFs, resulting in nearly $250 million in liquidations, have added downward pressure to the asset, according to Analyticsinsight. Ethereum Foundation-linked wallets sold a total of 4,000 ETH in November, including a 2,000 ETH transaction on November 13 that was converted to the USDS stablecoin, as reported by Cryptoticker, further increasing market supply. Simultaneously, Ethereum staking participation reached an all-time high of 36.3% of circulating supply, with 44.5 million ETH locked, while developers postponed the Glamsterdam upgrade on the Hoodi testnet following technical issues, according to Crypto, affecting expectations for upcoming network changes.
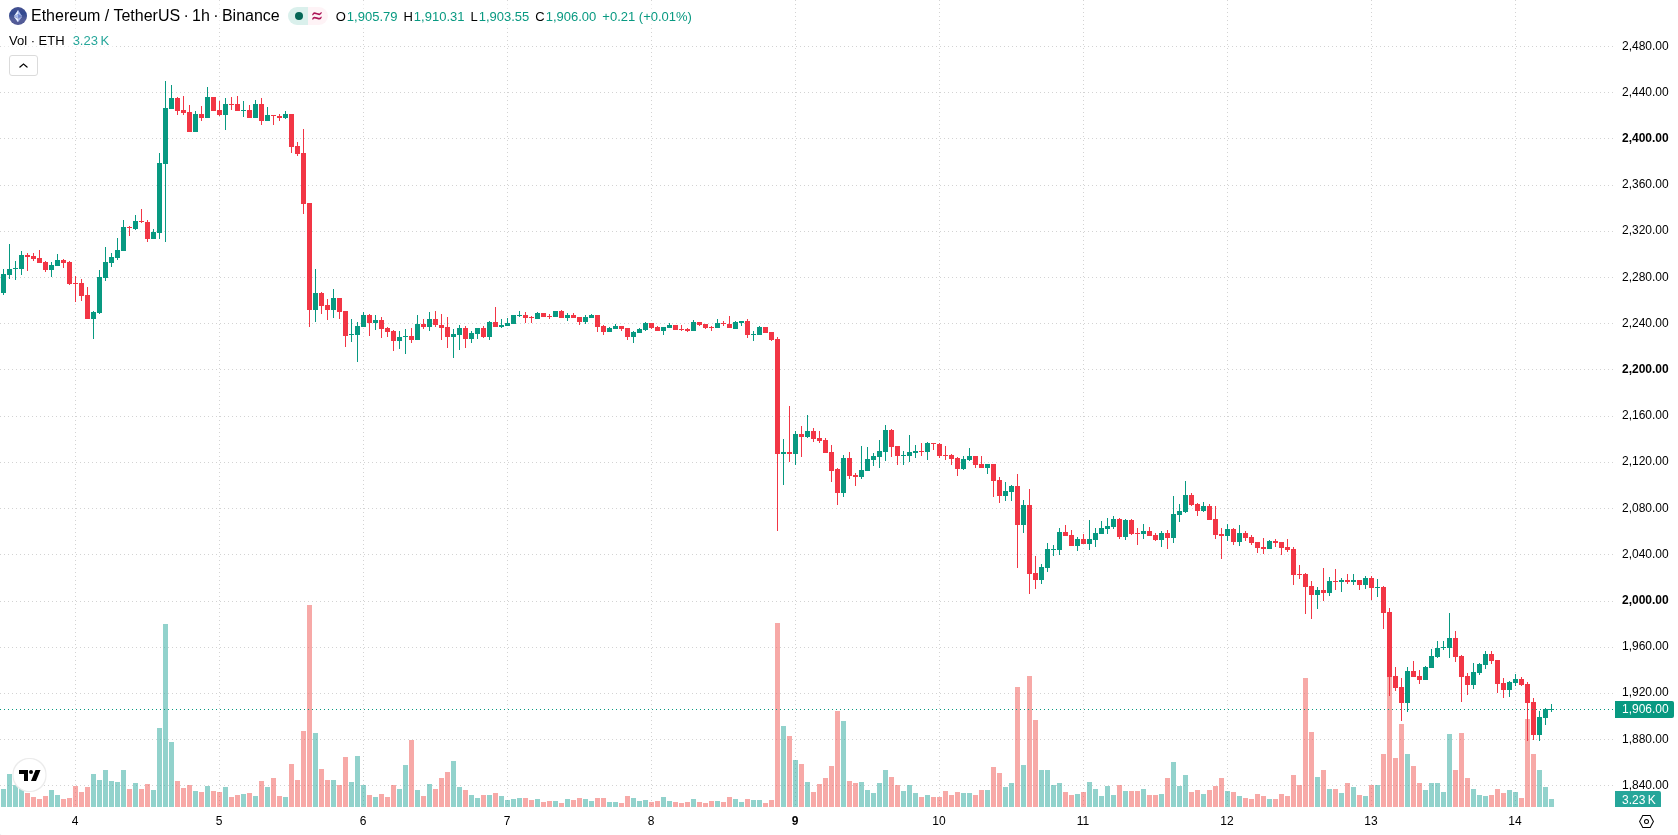
Oversold signals confirm sell pressure below technical resistance
On the hourly chart, ETH is positioned below the MA-20, MA-50, and the long-term MA-200, while the Ichimoku Kijun at $1,935 acts as immediate resistance. The technical landscape shows persistent negative momentum: both MACD and ADX point to a sell bias, and all three oscillators—RSI, Stochastic RSI, and CCI—remain deep in oversold territory. Seller dominance is underscored by a negative Bull/Bear Power reading and downside confirmation from the Awesome Oscillator, with price action sitting mid-range amidst elevated volatility.
Downside favored as range persists with low bullish odds
Over the next two to three sessions, ETH is expected to fluctuate within a volatility band of $1,741 to $1,984. The likelihood of an upward move is assessed at 25%, suggesting a higher probability for a downward breakout at 75%. If the asset remains range-bound, further consolidation could occur. To shift to a bullish scenario, price would need to break above the $1,935 resistance, while loss of support at $1,741 could trigger further declines.
Previously, analysts noted that persistent institutional outflows and delays in Ethereum's network upgrades had exacerbated downside risks for the asset. The latest data on ETF liquidations and on-chain sales by major wallets reinforce these concerns, making the $1,741 support level a critical threshold to monitor for further declines.











-
 Afghanistan
-
 Albania
-
 Algeria
-
 Angola
-
 Argentina
-
 Armenia
-
 Australia
-
 Austria
-
 Azerbaijan
-
 Bahamas
-
 Bahrain
-
 Bangladesh
-
 Belarus
-
 Belgium
-
 Bolivia
-
 Botswana
-
 Brazil
-
 Brunei
-
 Bulgaria
-
 Cambodia
-
 Cameroon
-
 Canada
-
 Chile
-
 China
-
 Colombia
-
 Congo
-
 Costa Rica
-
 Cote d'Ivoire
-
 Croatia
-
 Cuba
-
 Cyprus
-
 Czechia
-
 DR Congo
-
 Denmark
-
 Dominican Republic
-
 Ecuador
-
 Egypt
-
 El Salvador
-
 Estonia
-
 Eswatini
-
 Ethiopia
-
 Finland
-
 France
-
 Georgia
-
 Germany
-
 Ghana
-
 Greece
-
 Haiti
-
 Hong Kong
-
 Hungary
-
 India
-
 Indonesia
-
 Iran, Islamic republic
-
 Iraq
-
 Ireland
-
 Israel
-
 Italy
-
 Jamaica
-
 Japan
-
 Jordan
-
 Kazakhstan
-
 Kenya
-
 Korea
-
 Kuwait
-
 Kyrgyzstan
-
 Laos
-
 Latvia
-
 Lebanon
-
 Lesotho
-
 Libya
-
 Lithuania
-
 Luxembourg
-
 Madagascar
-
 Malaysia
-
 Malta
-
 Mauritius
-
 Mexico
-
 Moldova
-
 Mongolia
-
 Montenegro
-
 Morocco
-
 Mozambique
-
 Myanmar
-
 Namibia
-
 Nepal
-
 Netherlands
-
 New Zealand
-
 Nigeria
-
 North Macedonia
-
 Norway
-
 Oman
-
 Pakistan
-
 Palestine
-
 Panama
-
 Papua New Guinea
-
 Paraguay
-
 Peru
-
 Philippines
-
 Poland
-
 Portugal
-
 Puerto Rico
-
 Qatar
-
 Reunion
-
 Romania
-
 Rwanda
-
 Saudi Arabia
-
 Serbia
-
 Singapore
-
 Slovakia
-
 Slovenia
-
 Somalia
-
 South Africa
-
 Spain
-
 Sri Lanka
-
 Sweden
-
 Switzerland
-
 Syria
-
 Taiwan
-
 Tajikistan
-
 Tanzania
-
 Thailand
-
 Trinidad and Tobago
-
 Tunisia
-
 Turkey
-
 UAE
-
 Uganda
-
 Ukraine
-
 United Kingdom
-
United States
-
 Uruguay
-
 Uzbekistan
-
 Venezuela
-
 Vietnam
-
 Yemen
-
 Zambia
-
 Zimbabwe
- Forex
- Crypto












