

Kava technical analysis: Downward price move puts $0.0563 support in focus

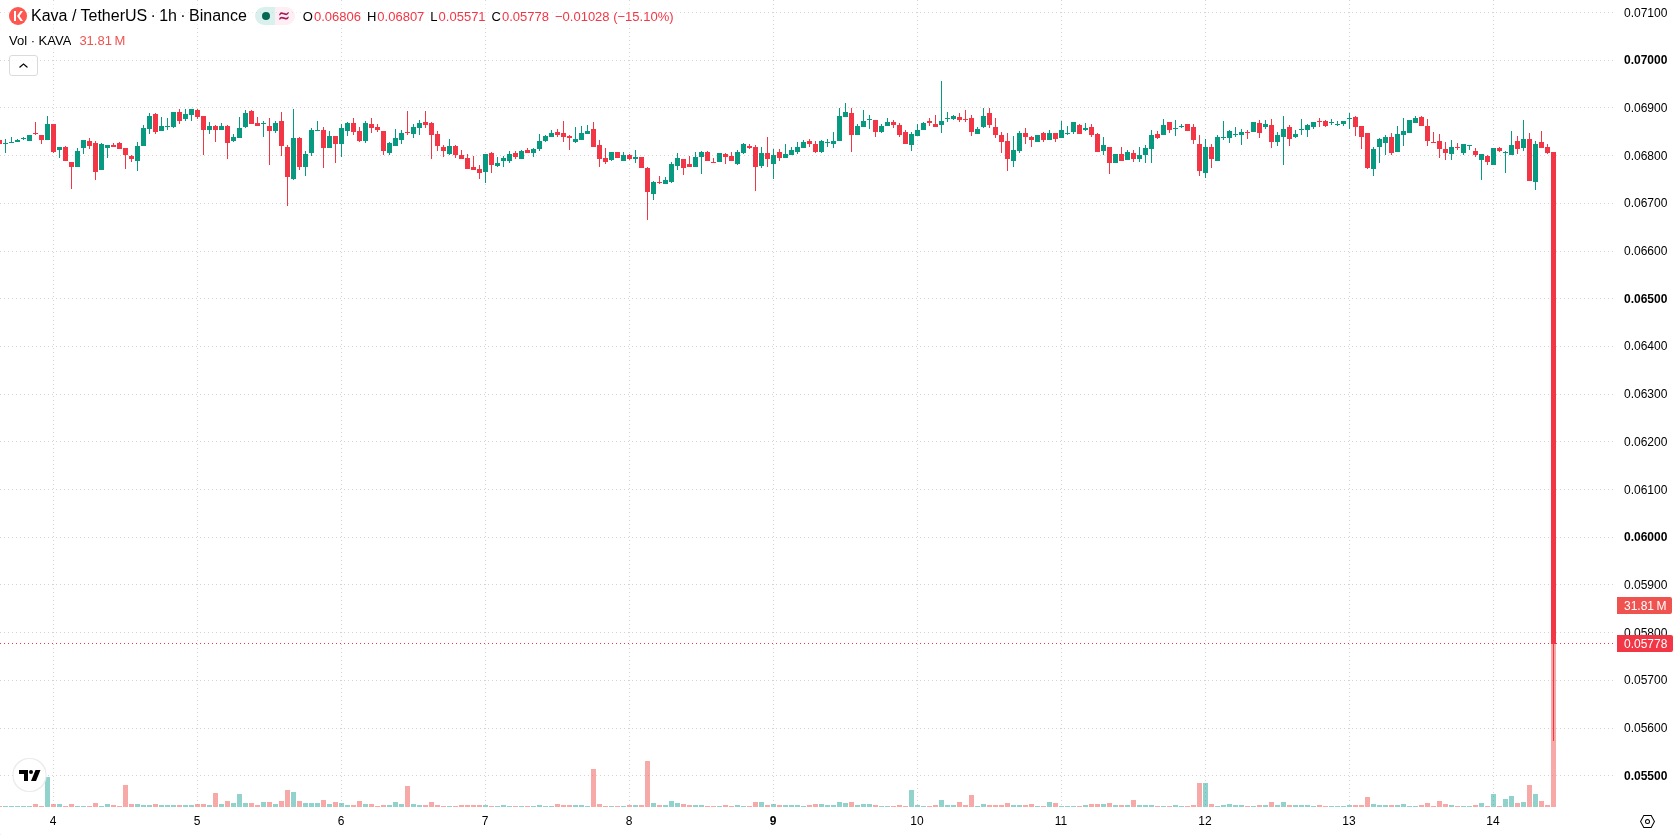
Kava (KAVA) is trading at $0.057, marking a sharp drop of 16.89% for the day. The asset is currently positioned below its key short- and medium-term moving averages, indicating significant intraday bearish momentum.
 0.0387
0.0696
Highlights
- KAVA/USD trades below key short- and medium-term moving averages, indicating persistent bearish momentum after falling 16.89% to $0.057.
- Momentum indicators show selling pressure dominates, with the Stoch RSI overbought and other oscillators neutral, suggesting upside exhaustion.
- KAVA/USD is expected to range between $0.0563 and $0.0675 over the next two to three days, with a high probability of further downside risk unless $0.068 resistance is broken.
Broadly bearish outlook as strong selling meets overbought signal
On the hourly chart, KAVA is trading below the MA-20 at $0.0681 and the MA-50 at $0.0683, while remaining above the long-term MA-200 at $0.0554. The Ichimoku Kijun at $0.068 currently acts as immediate resistance. MACD signals strong selling momentum, and ADX confirms the prevailing bearish bias. RSI and CCI are neutral, whereas Stochastic RSI is overbought, indicating possible upside exhaustion despite neutral signals from other oscillators. Bull/Bear Power is slightly positive, suggesting marginal buyer interest intraday, and the Awesome Oscillator remains neutral. These combined readings present a broadly bearish technical picture, though the overbought Stochastic RSI introduces a note of conflicting signal.
Further downside risk as rebound prospects remain weak
In the near term, KAVA is likely to fluctuate between $0.0563 and $0.0675. Downward momentum is dominant and any sustained rebound appears unlikely at this stage. Should the price break above the $0.068 resistance, a recovery could develop, but a drop below $0.0563 would expose further downside risk within the current volatility band.
Earlier, analysts noted that Kava was exhibiting strong bullish momentum, with price action supported by key moving averages and positive technical indicators. The sharp reversal below short- and medium-term averages now signals a shift to prevailing bearish momentum, making $0.068 a critical level for traders monitoring for signs of any potential recovery.











-
 Afghanistan
-
 Albania
-
 Algeria
-
 Angola
-
 Argentina
-
 Armenia
-
 Australia
-
 Austria
-
 Azerbaijan
-
 Bahamas
-
 Bahrain
-
 Bangladesh
-
 Belarus
-
 Belgium
-
 Bolivia
-
 Botswana
-
 Brazil
-
 Brunei
-
 Bulgaria
-
 Cambodia
-
 Cameroon
-
 Canada
-
 Chile
-
 China
-
 Colombia
-
 Congo
-
 Costa Rica
-
 Cote d'Ivoire
-
 Croatia
-
 Cuba
-
 Cyprus
-
 Czechia
-
 DR Congo
-
 Denmark
-
 Dominican Republic
-
 Ecuador
-
 Egypt
-
 El Salvador
-
 Estonia
-
 Eswatini
-
 Ethiopia
-
 Finland
-
 France
-
 Georgia
-
 Germany
-
 Ghana
-
 Greece
-
 Haiti
-
 Hong Kong
-
 Hungary
-
 India
-
 Indonesia
-
 Iran, Islamic republic
-
 Iraq
-
 Ireland
-
 Israel
-
 Italy
-
 Jamaica
-
 Japan
-
 Jordan
-
 Kazakhstan
-
 Kenya
-
 Korea
-
 Kuwait
-
 Kyrgyzstan
-
 Laos
-
 Latvia
-
 Lebanon
-
 Lesotho
-
 Libya
-
 Lithuania
-
 Luxembourg
-
 Madagascar
-
 Malaysia
-
 Malta
-
 Mauritius
-
 Mexico
-
 Moldova
-
 Mongolia
-
 Montenegro
-
 Morocco
-
 Mozambique
-
 Myanmar
-
 Namibia
-
 Nepal
-
 Netherlands
-
 New Zealand
-
 Nigeria
-
 North Macedonia
-
 Norway
-
 Oman
-
 Pakistan
-
 Palestine
-
 Panama
-
 Papua New Guinea
-
 Paraguay
-
 Peru
-
 Philippines
-
 Poland
-
 Portugal
-
 Puerto Rico
-
 Qatar
-
 Reunion
-
 Romania
-
 Rwanda
-
 Saudi Arabia
-
 Serbia
-
 Singapore
-
 Slovakia
-
 Slovenia
-
 Somalia
-
 South Africa
-
 Spain
-
 Sri Lanka
-
 Sweden
-
 Switzerland
-
 Syria
-
 Taiwan
-
 Tajikistan
-
 Tanzania
-
 Thailand
-
 Trinidad and Tobago
-
 Tunisia
-
 Turkey
-
 UAE
-
 Uganda
-
 Ukraine
-
 United Kingdom
-
United States
-
 Uruguay
-
 Uzbekistan
-
 Venezuela
-
 Vietnam
-
 Yemen
-
 Zambia
-
 Zimbabwe
- Forex
- Crypto












