

Hyperliquid price extends downward move as sellers dominate across all timeframes

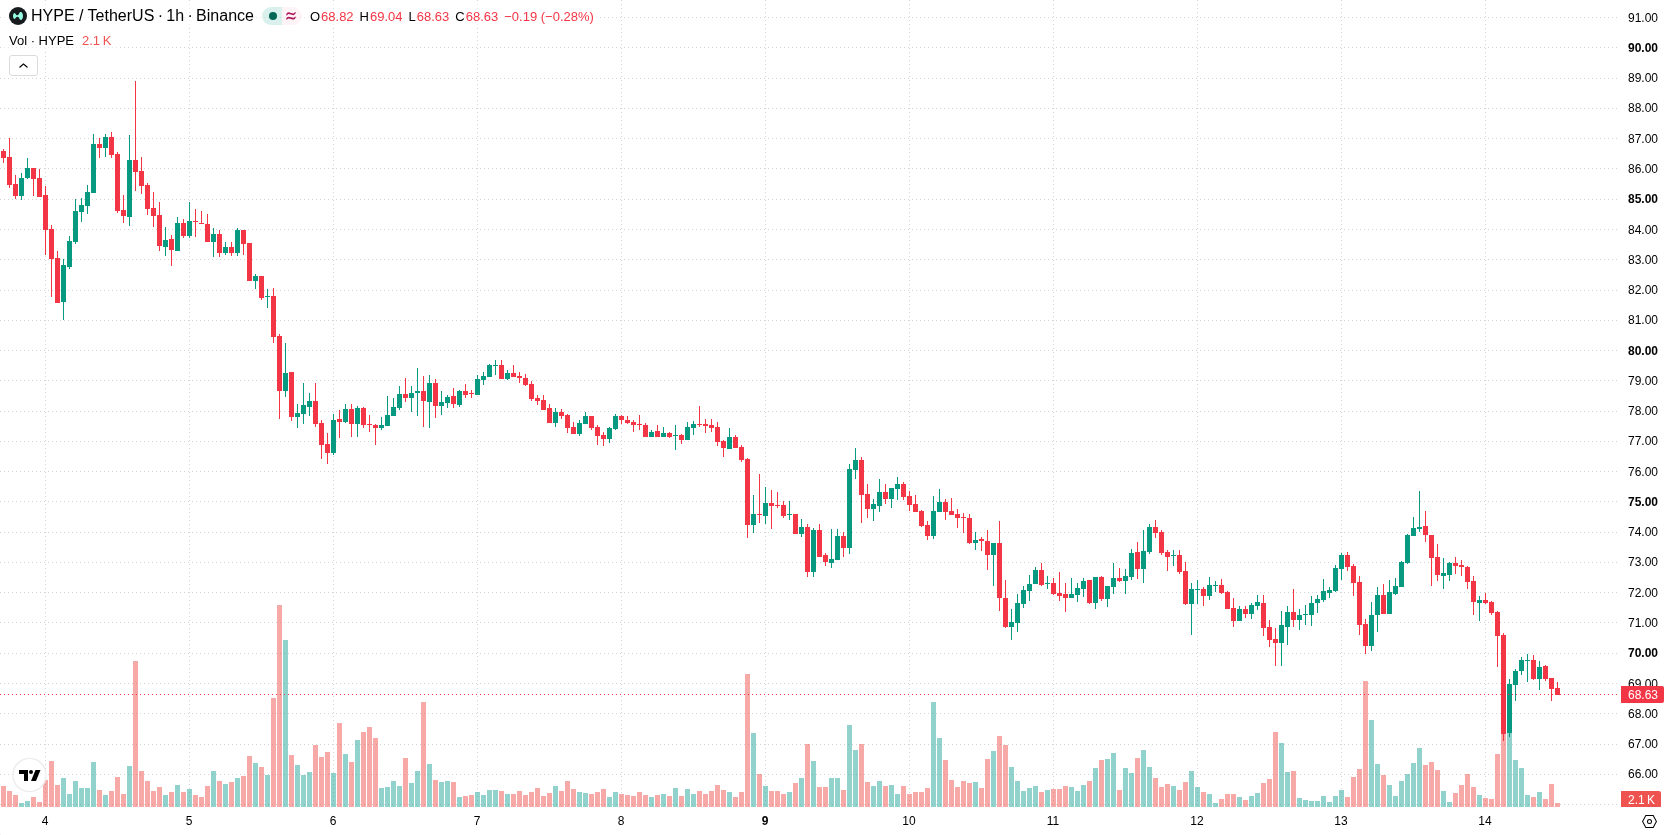
Hyperliquid (HYPE) is trading at $68.73, marking a decline of 7.08% for the day. The price sits below its key moving averages, reflecting prevailing short-term downward momentum.
 71.95
78.15
Highlights
- Hyperliquid reported record open interest at $18.1 billion and raised its market share to 11.7% among eight major exchanges in the third quarter.
- Quarterly revenue climbed 21.7% to $190.9 million, supported by USDC reserve earnings and increased trading volumes, with $148.7 million spent on HYPE buybacks.
- HYPE/USD trades under key moving averages with strong downside signals dominating; next 1 to 3 days expect a $66.10 to $70.66 range and continued bearish pressure.
Trading activity and liquidity expand despite persistent selling pressure
In the third quarter, Hyperliquid set a record in open interest at $18.1 billion and raised its market share to 11.7% across eight major exchanges, reflecting a marked increase in trading activity and platform liquidity, according to FXStreet. Quarterly results also revealed $190.9 million in revenue, up 21.7% from the previous quarter, driven by USDC reserve earnings and heightened trading volumes. Additional Q3 developments included $148.7 million in HYPE buybacks by the Assistance Fund, a $35.3 million investment disclosure from Canada’s Healthcare of Ontario Pension Plan in Hyperliquid Strategies, and the November 13 integration of the Elysium ecosystem with Gate to expand blockchain tool access. These fundamental improvements unfolded as price action has remained under broader selling pressure.
Downside momentum persists amid resistance at Kijun and neutral oscillators
Technically, HYPE/USD remains below the MA-20, MA-50, and daily MA-200, indicating active downside pressure across all observed timeframes. The Ichimoku Kijun is established at $71.22, serving as the nearest resistance. Intraday, price action is contained by this band, while support emerges at $66.10. MACD and ADX both point to continued sell conditions. The RSI stands at 37.01, the Stoch RSI at 71.53, and the CCI at -81.01, collectively in their neutral zones with no sign of exhaustion. Bull/Bear Power is negative at -0.69, showing sellers maintain control intraday. The Awesome Oscillator is neutral with no additional trend signal.
Consolidation likely as further downside risks persist below resistance
Looking ahead 1–3 trading days, HYPE/USD is likely to consolidate between $66.10 and $70.66 as the predominant volatility band relative to current levels. A continued downward move is probable unless price recovers above the $71.22 resistance, which would open a path for recovery. Conversely, a decisive break below $66.10 could trigger further declines, marking an extension of the current downside scenario.
Previously it was reported that a notable surge in crypto derivatives activity and open interest alongside increased protocol revenue in the third quarter. The current analysis adds that, despite these underlying growth drivers, the prevailing downside scenario remains intact, making the $66.10 level a critical threshold for traders to monitor in the near term.






Latest Hyperliquid News





-
 Afghanistan
-
 Albania
-
 Algeria
-
 Angola
-
 Argentina
-
 Armenia
-
 Australia
-
 Austria
-
 Azerbaijan
-
 Bahamas
-
 Bahrain
-
 Bangladesh
-
 Belarus
-
 Belgium
-
 Bolivia
-
 Botswana
-
 Brazil
-
 Brunei
-
 Bulgaria
-
 Cambodia
-
 Cameroon
-
 Canada
-
 Chile
-
 China
-
 Colombia
-
 Congo
-
 Costa Rica
-
 Cote d'Ivoire
-
 Croatia
-
 Cuba
-
 Cyprus
-
 Czechia
-
 DR Congo
-
 Denmark
-
 Dominican Republic
-
 Ecuador
-
 Egypt
-
 El Salvador
-
 Estonia
-
 Eswatini
-
 Ethiopia
-
 Finland
-
 France
-
 Georgia
-
 Germany
-
 Ghana
-
 Greece
-
 Haiti
-
 Hong Kong
-
 Hungary
-
 India
-
 Indonesia
-
 Iran, Islamic republic
-
 Iraq
-
 Ireland
-
 Israel
-
 Italy
-
 Jamaica
-
 Japan
-
 Jordan
-
 Kazakhstan
-
 Kenya
-
 Korea
-
 Kuwait
-
 Kyrgyzstan
-
 Laos
-
 Latvia
-
 Lebanon
-
 Lesotho
-
 Libya
-
 Lithuania
-
 Luxembourg
-
 Madagascar
-
 Malaysia
-
 Malta
-
 Mauritius
-
 Mexico
-
 Moldova
-
 Mongolia
-
 Montenegro
-
 Morocco
-
 Mozambique
-
 Myanmar
-
 Namibia
-
 Nepal
-
 Netherlands
-
 New Zealand
-
 Nigeria
-
 North Macedonia
-
 Norway
-
 Oman
-
 Pakistan
-
 Palestine
-
 Panama
-
 Papua New Guinea
-
 Paraguay
-
 Peru
-
 Philippines
-
 Poland
-
 Portugal
-
 Puerto Rico
-
 Qatar
-
 Reunion
-
 Romania
-
 Rwanda
-
 Saudi Arabia
-
 Serbia
-
 Singapore
-
 Slovakia
-
 Slovenia
-
 Somalia
-
 South Africa
-
 Spain
-
 Sri Lanka
-
 Sweden
-
 Switzerland
-
 Syria
-
 Taiwan
-
 Tajikistan
-
 Tanzania
-
 Thailand
-
 Trinidad and Tobago
-
 Tunisia
-
 Turkey
-
 UAE
-
 Uganda
-
 Ukraine
-
 United Kingdom
-
United States
-
 Uruguay
-
 Uzbekistan
-
 Venezuela
-
 Vietnam
-
 Yemen
-
 Zambia
-
 Zimbabwe
- Forex
- Crypto












