

Solana falls over 6% as ETF outflows and technical weakness weigh on sentiment

Solana (SOL) dropped 6.13% as sustained outflows from US spot Solana ETFs and a shift in on-chain activity weighed on sentiment. The downside move is reinforced by technical weakness, with the token trading well below all major moving averages and sellers maintaining control across short, medium, and long-term timeframes.
 74.6
82.38
Highlights
- The Depository Trust & Clearing Corporation plans to link its Tokenization Service to Solana by 2027 for settlement of financial assets on blockchain.
- Solana Company reported $3.4 million in Q3 2026 staking revenue and expanded validator operations, while Solana trades under broader selling pressure.
- SOL/USD trades below key moving averages with bearish momentum; next five day range projected at $67.5 to $82.17.
Institutional blockchain integration and mixed capital flows as price stalls
The Depository Trust & Clearing Corporation announced plans to connect its Tokenization Service with Solana, aiming for a 2027 rollout to facilitate settlement and management of traditional financial assets on the blockchain. Recent ETF activity included a $13.4 million net outflow on November 10, along with smaller outflows and a $1.69 million inflow on November 12. On-chain, memecoin trading volume declined while stablecoin swaps and tokenized equities transactions grew, and Solana Company reported $3.4 million in Q3 2026 staking revenue and expanded validator operations, though price action has remained under broader selling pressure.
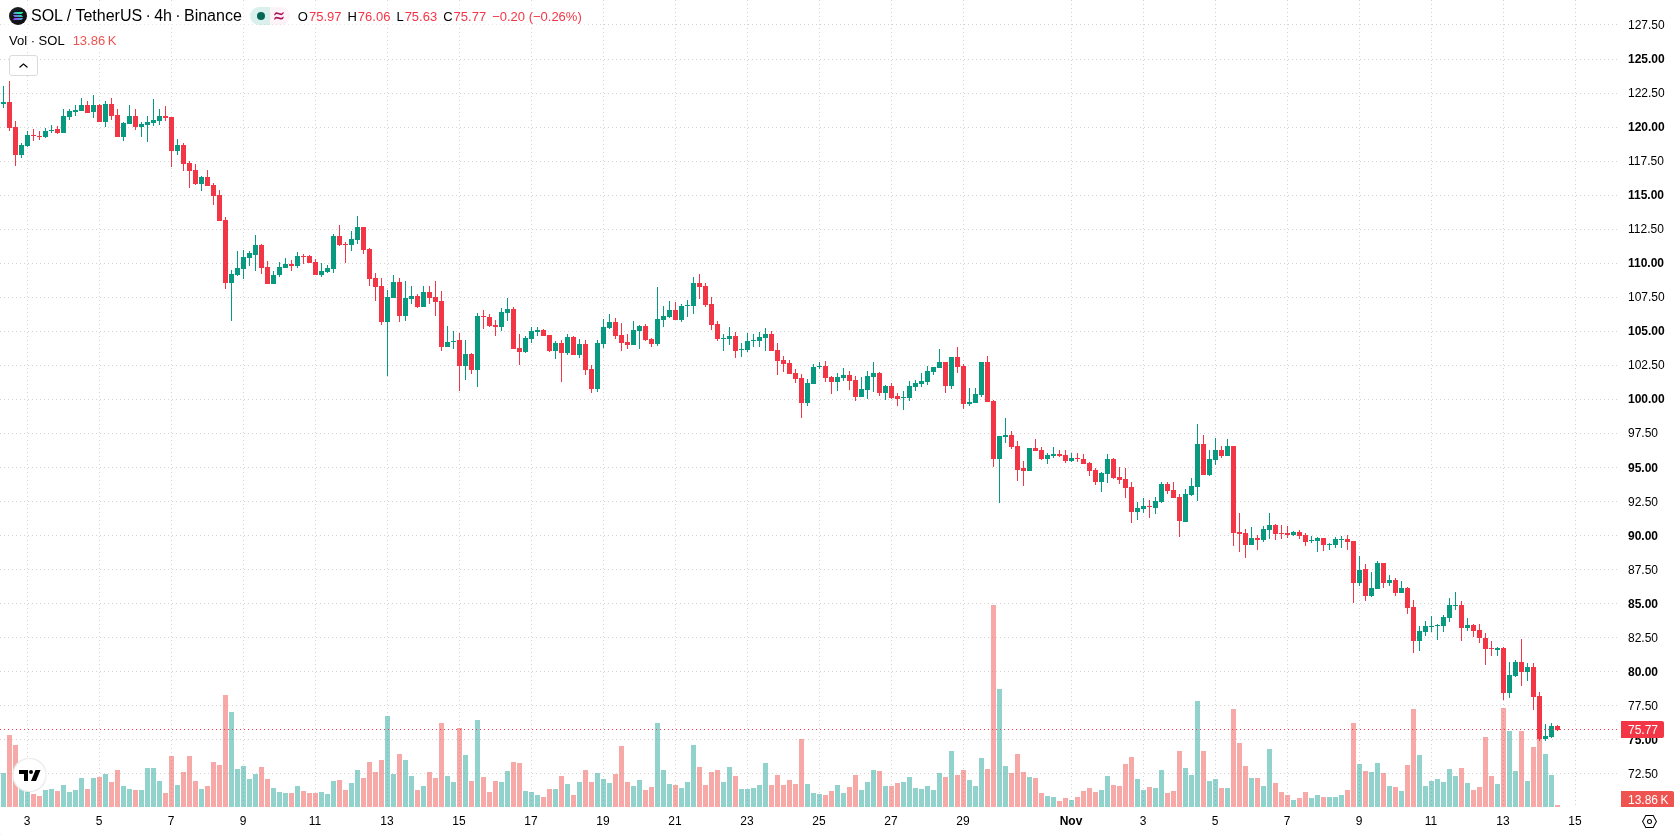
Multi-timeframe selling pressure affirmed by oversold technicals and volatility jump
SOL/USD is trading below the 20-day, 50-day, and 200-day moving averages, with a current price of $75.76 compared to the MA-20 at $91.95, MA-50 at $103.98, and MA-200 at $88.98. This alignment indicates persistent selling pressure across all timeframes. The nearest resistance sits at $77.19, and immediate support is at $74.85. Momentum indicators are decisively bearish: both MACD and ADX signal continued downside, while the RSI, Stochastic RSI, and CCI are all in oversold territory. Sellers dominate intraday momentum according to BBP, with the Awesome Oscillator confirming the downward trend. The pair has shed $4.95, or 6.13%, trading near session lows after a gap-down open, and intraday volatility is elevated at 4.88%.
Previously it was reported that Solana was experiencing persistent bearish momentum, with both technical indicators and fundamental developments failing to offset ongoing downside risks. The current analysis reinforces this outlook by highlighting sustained selling pressure and ETF outflows, making the $67.5 support level a crucial threshold for traders to monitor over the coming sessions.











-
 Afghanistan
-
 Albania
-
 Algeria
-
 Angola
-
 Argentina
-
 Armenia
-
 Australia
-
 Austria
-
 Azerbaijan
-
 Bahamas
-
 Bahrain
-
 Bangladesh
-
 Belarus
-
 Belgium
-
 Bolivia
-
 Botswana
-
 Brazil
-
 Brunei
-
 Bulgaria
-
 Cambodia
-
 Cameroon
-
 Canada
-
 Chile
-
 China
-
 Colombia
-
 Congo
-
 Costa Rica
-
 Cote d'Ivoire
-
 Croatia
-
 Cuba
-
 Cyprus
-
 Czechia
-
 DR Congo
-
 Denmark
-
 Dominican Republic
-
 Ecuador
-
 Egypt
-
 El Salvador
-
 Estonia
-
 Eswatini
-
 Ethiopia
-
 Finland
-
 France
-
 Georgia
-
 Germany
-
 Ghana
-
 Greece
-
 Haiti
-
 Hong Kong
-
 Hungary
-
 India
-
 Indonesia
-
 Iran, Islamic republic
-
 Iraq
-
 Ireland
-
 Israel
-
 Italy
-
 Jamaica
-
 Japan
-
 Jordan
-
 Kazakhstan
-
 Kenya
-
 Korea
-
 Kuwait
-
 Kyrgyzstan
-
 Laos
-
 Latvia
-
 Lebanon
-
 Lesotho
-
 Libya
-
 Lithuania
-
 Luxembourg
-
 Madagascar
-
 Malaysia
-
 Malta
-
 Mauritius
-
 Mexico
-
 Moldova
-
 Mongolia
-
 Montenegro
-
 Morocco
-
 Mozambique
-
 Myanmar
-
 Namibia
-
 Nepal
-
 Netherlands
-
 New Zealand
-
 Nigeria
-
 North Macedonia
-
 Norway
-
 Oman
-
 Pakistan
-
 Palestine
-
 Panama
-
 Papua New Guinea
-
 Paraguay
-
 Peru
-
 Philippines
-
 Poland
-
 Portugal
-
 Puerto Rico
-
 Qatar
-
 Reunion
-
 Romania
-
 Rwanda
-
 Saudi Arabia
-
 Serbia
-
 Singapore
-
 Slovakia
-
 Slovenia
-
 Somalia
-
 South Africa
-
 Spain
-
 Sri Lanka
-
 Sweden
-
 Switzerland
-
 Syria
-
 Taiwan
-
 Tajikistan
-
 Tanzania
-
 Thailand
-
 Trinidad and Tobago
-
 Tunisia
-
 Turkey
-
 UAE
-
 Uganda
-
 Ukraine
-
 United Kingdom
-
United States
-
 Uruguay
-
 Uzbekistan
-
 Venezuela
-
 Vietnam
-
 Yemen
-
 Zambia
-
 Zimbabwe
- Forex
- Crypto












