

Binance Coin slides while technical weakness and seller pressure persist

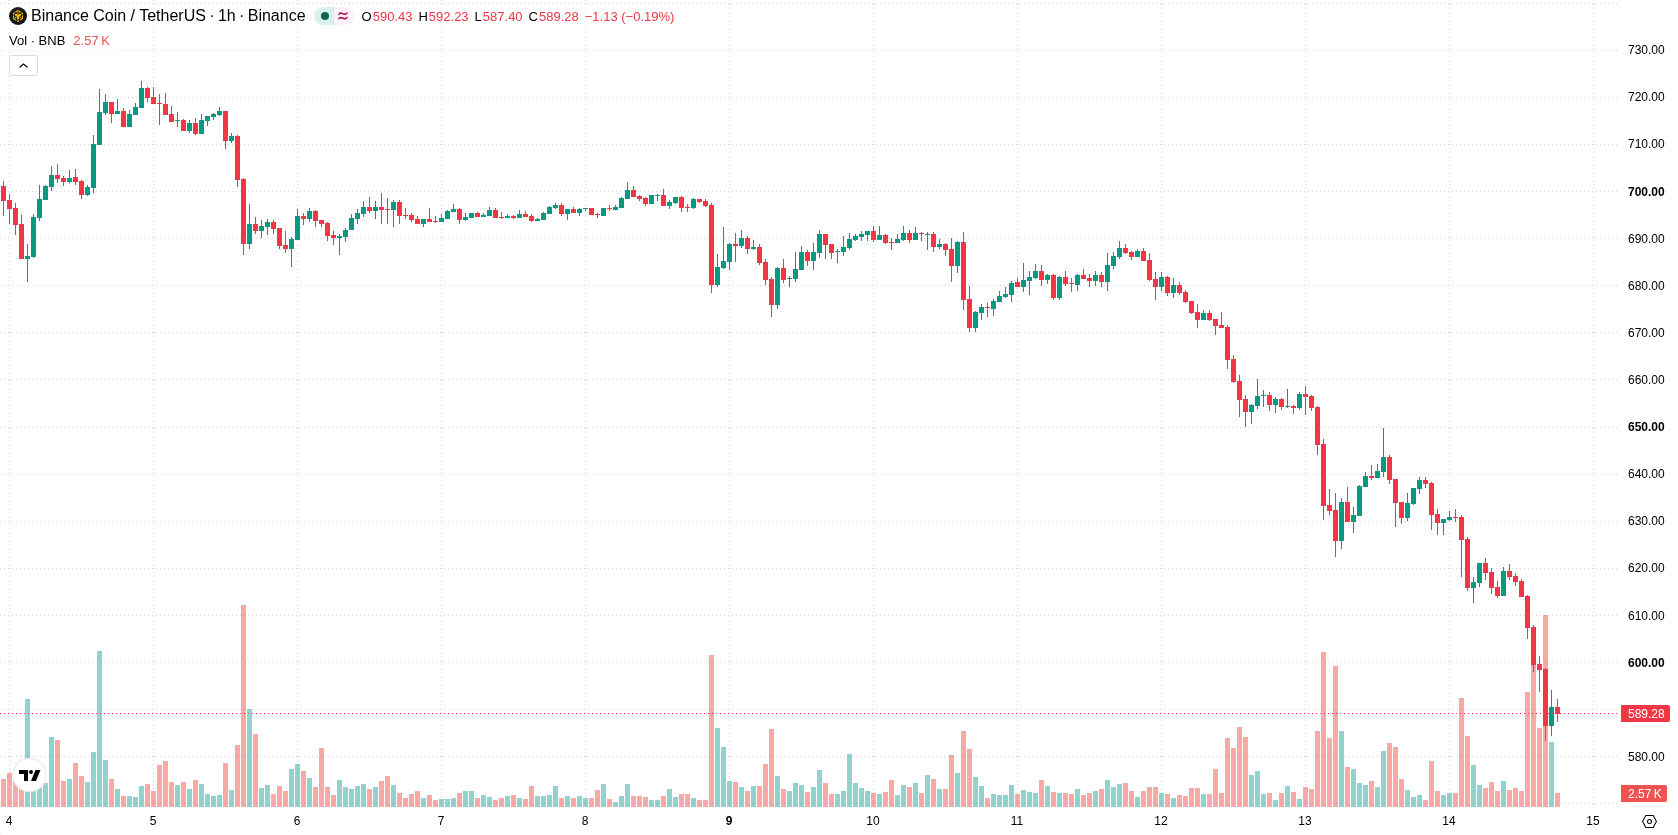
Binance Coin (BNB) is trading at $588.68 after falling 7.36% today. The asset remains below its key moving averages, reflecting ongoing selling pressure.
 599.72
692.64
Highlights
- Binance resumed withdrawals on 87 networks and replaced $6.3 billion in hacked assets using reserve and insurance funds.
- A new Proof of Reserves accounting for 198 tokens was released after the breach, with U.S. efforts freezing $2.7 billion in stolen funds.
- BNB/USD trades below key moving averages with momentum indicators negative, expected to range between $570.9 and $606.46 over the next 2 to 3 days.
Asset security reinforced as Binance, DOJ act on breach aftermath
Binance restored withdrawals across 87 networks following its recent $6.3 billion hack, re-enabling user access and asset mobility, according to Ndtvprofit. To address the breach, Binance fully replaced lost assets using SAFU, futures insurance, and treasury funds, and released a new Proof of Reserves covering 198 tokens including Binance Coin, as reported by Cryptotimes, providing reassurance of post-incident transparency and loss coverage. In parallel, the U.S. Department of Justice secured court authorization to seize or restrict over $1.2 billion of hacked cryptocurrency, with combined U.S. and private sector efforts freezing more than $2.7 billion of stolen assets, according to Economictimes Indiatimes, indicating ongoing regulatory intervention in the breach aftermath.
Sustained technical weakness amid oversold signals and no reversal
BNB/USD remains below the MA-20 at $614.9, MA-50 at $631.37, and MA-200 at $658.83, highlighting persistent technical weakness across all key timeframes. Immediate resistance is located at the Ichimoku Kijun level of $611.23. Bearish momentum is confirmed by negative MACD and ADX readings, while RSI, Stoch RSI, and CCI are all deep within their oversold zones, hinting at possible seller exhaustion but not a reversal. Bull/Bear Power stays negative, and the Awesome Oscillator continues to underline the prevailing downside. The absence of divergent signals or bullish contradictions emphasizes continued selling interest.
Downside risk dominates as breakout probability remains limited
Over the next 2 to 3 trading days, BNB/USD is expected to fluctuate between $570.9 and $606.46, in line with typical volatility seen during such high-volume trading phases. The probability of an upside move is currently low at 22%, suggesting further downside continuation with a 78% likelihood. If immediate resistance near $611.23 is breached, a short-term rebound could develop, but if support at $570.9 fails, deeper declines are likely in the near term.
Earlier, analysts noted that Binance Coin was experiencing consistent selling pressure and downside risk, even as efforts to restore ecosystem stability had not led to improved price momentum. The latest developments reinforce this bearish outlook, with technical readings and volatility suggesting traders should monitor $570.9 as a crucial support level for any signs of capitulation or potential stabilization in the coming days.











-
 Afghanistan
-
 Albania
-
 Algeria
-
 Angola
-
 Argentina
-
 Armenia
-
 Australia
-
 Austria
-
 Azerbaijan
-
 Bahamas
-
 Bahrain
-
 Bangladesh
-
 Belarus
-
 Belgium
-
 Bolivia
-
 Botswana
-
 Brazil
-
 Brunei
-
 Bulgaria
-
 Cambodia
-
 Cameroon
-
 Canada
-
 Chile
-
 China
-
 Colombia
-
 Congo
-
 Costa Rica
-
 Cote d'Ivoire
-
 Croatia
-
 Cuba
-
 Cyprus
-
 Czechia
-
 DR Congo
-
 Denmark
-
 Dominican Republic
-
 Ecuador
-
 Egypt
-
 El Salvador
-
 Estonia
-
 Eswatini
-
 Ethiopia
-
 Finland
-
 France
-
 Georgia
-
 Germany
-
 Ghana
-
 Greece
-
 Haiti
-
 Hong Kong
-
 Hungary
-
 India
-
 Indonesia
-
 Iran, Islamic republic
-
 Iraq
-
 Ireland
-
 Israel
-
 Italy
-
 Jamaica
-
 Japan
-
 Jordan
-
 Kazakhstan
-
 Kenya
-
 Korea
-
 Kuwait
-
 Kyrgyzstan
-
 Laos
-
 Latvia
-
 Lebanon
-
 Lesotho
-
 Libya
-
 Lithuania
-
 Luxembourg
-
 Madagascar
-
 Malaysia
-
 Malta
-
 Mauritius
-
 Mexico
-
 Moldova
-
 Mongolia
-
 Montenegro
-
 Morocco
-
 Mozambique
-
 Myanmar
-
 Namibia
-
 Nepal
-
 Netherlands
-
 New Zealand
-
 Nigeria
-
 North Macedonia
-
 Norway
-
 Oman
-
 Pakistan
-
 Palestine
-
 Panama
-
 Papua New Guinea
-
 Paraguay
-
 Peru
-
 Philippines
-
 Poland
-
 Portugal
-
 Puerto Rico
-
 Qatar
-
 Reunion
-
 Romania
-
 Rwanda
-
 Saudi Arabia
-
 Serbia
-
 Singapore
-
 Slovakia
-
 Slovenia
-
 Somalia
-
 South Africa
-
 Spain
-
 Sri Lanka
-
 Sweden
-
 Switzerland
-
 Syria
-
 Taiwan
-
 Tajikistan
-
 Tanzania
-
 Thailand
-
 Trinidad and Tobago
-
 Tunisia
-
 Turkey
-
 UAE
-
 Uganda
-
 Ukraine
-
 United Kingdom
-
United States
-
 Uruguay
-
 Uzbekistan
-
 Venezuela
-
 Vietnam
-
 Yemen
-
 Zambia
-
 Zimbabwe
- Forex
- Crypto












