


VeChain (VET) fell 8.02% as persistent selling pressure and negative technical momentum drove the move. The decline is supported by the token trading well below its 20-day, 50-day, and 200-day moving averages, highlighting sustained weakness across all timeframes.
 0.005094
0.00537000
Highlights
- VET/USD trades below key moving averages, confirming sustained downward pressure across all time frames.
- Momentum indicators remain bearish, with intraday price near session low and no sign of a rebound.
- The expected five-day range is $0.004416 to $0.004961, with over 80% probability of further declines.
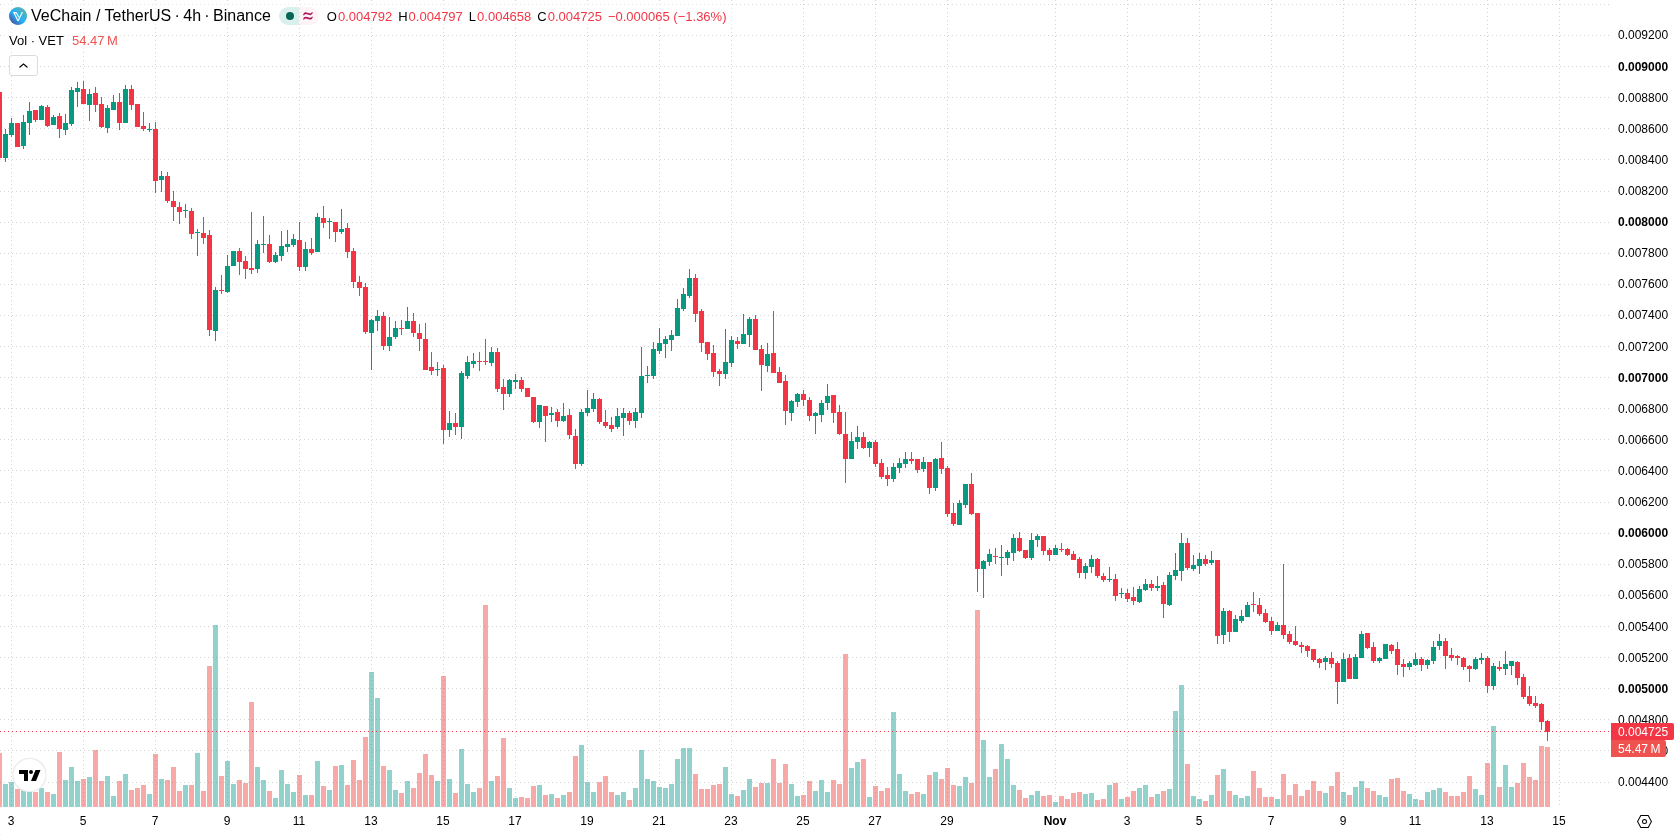
Oversold signals emerge as multi-timeframe bearish momentum dominates
VET/USD is trading well below its 20-day, 50-day, and 200-day moving averages, with recent levels at $0.0056842, $0.00703762, and $0.00615034. This configuration points to strong downward pressure over short-, medium-, and long-term horizons. The MA-50 is still above the MA-200, but near-term action remains constrained between resistance at $0.004753 and support at $0.004416. Momentum is heavily skewed to the downside. The Relative Strength Index (RSI) is in oversold territory, signaling possible selling exhaustion. The Stochastic RSI and Commodity Channel Index (CCI) are both neutral. Both the MACD and Average Directional Index (ADX) indicate persistent bearish momentum, and intraday flows are dominated by sellers according to Bull/Bear Power. VET/USD is trading close to the session low with elevated intraday volatility at 7.17% and a downside gap of about 1.25%. The intraday tone stays pressured without signs of a sustainable rebound.
Earlier, analysts noted that VeChain was experiencing persistent technical weakness amid prevailing bearish momentum. The current analysis reinforces this outlook, with continued downside pressure suggesting traders should closely monitor the $0.004416 support level for any potential break lower.










-
 Afghanistan
-
 Albania
-
 Algeria
-
 Angola
-
 Argentina
-
 Armenia
-
 Australia
-
 Austria
-
 Azerbaijan
-
 Bahamas
-
 Bahrain
-
 Bangladesh
-
 Belarus
-
 Belgium
-
 Bolivia
-
 Botswana
-
 Brazil
-
 Brunei
-
 Bulgaria
-
 Cambodia
-
 Cameroon
-
 Canada
-
 Chile
-
 China
-
 Colombia
-
 Congo
-
 Costa Rica
-
 Cote d'Ivoire
-
 Croatia
-
 Cuba
-
 Cyprus
-
 Czechia
-
 DR Congo
-
 Denmark
-
 Dominican Republic
-
 Ecuador
-
 Egypt
-
 El Salvador
-
 Estonia
-
 Eswatini
-
 Ethiopia
-
 Finland
-
 France
-
 Georgia
-
 Germany
-
 Ghana
-
 Greece
-
 Haiti
-
 Hong Kong
-
 Hungary
-
 India
-
 Indonesia
-
 Iran, Islamic republic
-
 Iraq
-
 Ireland
-
 Israel
-
 Italy
-
 Jamaica
-
 Japan
-
 Jordan
-
 Kazakhstan
-
 Kenya
-
 Korea
-
 Kuwait
-
 Kyrgyzstan
-
 Laos
-
 Latvia
-
 Lebanon
-
 Lesotho
-
 Libya
-
 Lithuania
-
 Luxembourg
-
 Madagascar
-
 Malaysia
-
 Malta
-
 Mauritius
-
 Mexico
-
 Moldova
-
 Mongolia
-
 Montenegro
-
 Morocco
-
 Mozambique
-
 Myanmar
-
 Namibia
-
 Nepal
-
 Netherlands
-
 New Zealand
-
 Nigeria
-
 North Macedonia
-
 Norway
-
 Oman
-
 Pakistan
-
 Palestine
-
 Panama
-
 Papua New Guinea
-
 Paraguay
-
 Peru
-
 Philippines
-
 Poland
-
 Portugal
-
 Puerto Rico
-
 Qatar
-
 Reunion
-
 Romania
-
 Rwanda
-
 Saudi Arabia
-
 Serbia
-
 Singapore
-
 Slovakia
-
 Slovenia
-
 Somalia
-
 South Africa
-
 Spain
-
 Sri Lanka
-
 Sweden
-
 Switzerland
-
 Syria
-
 Taiwan
-
 Tajikistan
-
 Tanzania
-
 Thailand
-
 Trinidad and Tobago
-
 Tunisia
-
 Turkey
-
 UAE
-
 Uganda
-
 Ukraine
-
 United Kingdom
-
United States
-
 Uruguay
-
 Uzbekistan
-
 Venezuela
-
 Vietnam
-
 Yemen
-
 Zambia
-
 Zimbabwe
- Forex
- Crypto












