

RENDER sinks as downward price move gathers momentum

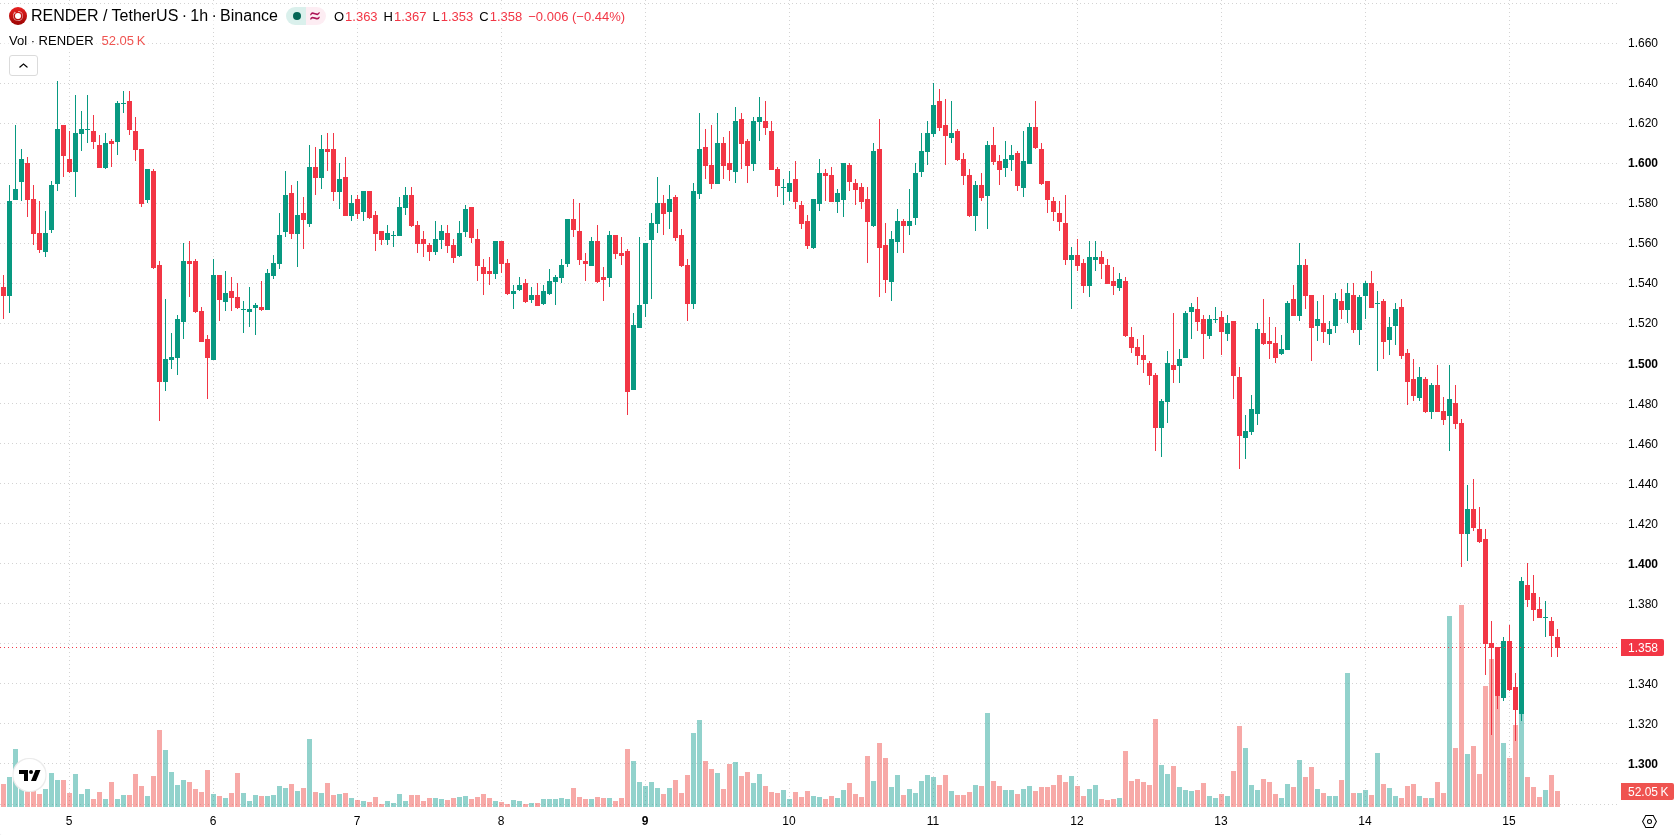
Render (RENDER) is trading at $1.353, down 9.13% on the day. The asset has slipped further below its short- and long-term moving averages, reflecting broad pressure within a high-volatility session.
 1.4
1.6400
Highlights
- Render experienced a spike in trading volume that increased volatility and selling pressure, creating a fragile market structure.
- Market participants are now risk-averse toward Render as combined technical signals and trading flow strengthen the defensive tone.
- Render trades below key moving averages with bearish momentum; price is forecast to move between $1.2801 and $1.4259 over the next 2 to 3 days.
Heightened selling pressure as volume surge signals increased risk
Technical indicators pointed to a fragile market structure for Render, with unusually high trading volume recorded, according to Diariobitcoin. Elevated volume typically reflects a heightened response from market participants, amplifying both selling pressure and volatility. The combination of these technical signals and trading flow has contributed to the risk-off tone now present in the asset.
Persistent seller control as bearish signals and soft support converge
RENDER currently sits below the MA-20 at $1.3955, MA-50 at $1.468, and MA-200 at $1.6558, confirming persistent seller dominance across all trend horizons. Immediate overhead resistance is found at the Ichimoku Kijun level near $1.4215, while intraday support is less defined but pivots around lower highs from prior sessions. Momentum readings show MACD at Strong Sell and ADX at Sell, highlighting clear intraday bearish pressure. The RSI and CCI both remain neutral, while Stoch RSI has moved into the overbought zone, indicating a risk of short-term corrective swings. Bull/Bear Power is negative at -0.0072, confirming dominant selling activity, while the Awesome Oscillator is neutral and does not currently influence the technical scenario.
Sideways-to-lower risk as volatility band caps upside potential
RENDER is expected to trade within a $1.2801 to $1.4259 volatility band over the next two to three days, with a very low probability of a sustained uplink and a high probability of further downside. The baseline scenario envisions choppy sideways movement within this range. A decisive break above the $1.4215 Kijun resistance could shift momentum bullish, whereas a drop below $1.2801 would trigger a new leg lower and reinforce the prevailing bearish trend.
Earlier, analysts noted that downside risk for Render remained dominant amid persistent bearish momentum and ongoing support tests. Current technical readings reinforce this cautious outlook, highlighting $1.4215 as a crucial resistance level to monitor for any potential shift in short-term trend dynamics.










-
 Afghanistan
-
 Albania
-
 Algeria
-
 Angola
-
 Argentina
-
 Armenia
-
 Australia
-
 Austria
-
 Azerbaijan
-
 Bahamas
-
 Bahrain
-
 Bangladesh
-
 Belarus
-
 Belgium
-
 Bolivia
-
 Botswana
-
 Brazil
-
 Brunei
-
 Bulgaria
-
 Cambodia
-
 Cameroon
-
 Canada
-
 Chile
-
 China
-
 Colombia
-
 Congo
-
 Costa Rica
-
 Cote d'Ivoire
-
 Croatia
-
 Cuba
-
 Cyprus
-
 Czechia
-
 DR Congo
-
 Denmark
-
 Dominican Republic
-
 Ecuador
-
 Egypt
-
 El Salvador
-
 Estonia
-
 Eswatini
-
 Ethiopia
-
 Finland
-
 France
-
 Georgia
-
 Germany
-
 Ghana
-
 Greece
-
 Haiti
-
 Hong Kong
-
 Hungary
-
 India
-
 Indonesia
-
 Iran, Islamic republic
-
 Iraq
-
 Ireland
-
 Israel
-
 Italy
-
 Jamaica
-
 Japan
-
 Jordan
-
 Kazakhstan
-
 Kenya
-
 Korea
-
 Kuwait
-
 Kyrgyzstan
-
 Laos
-
 Latvia
-
 Lebanon
-
 Lesotho
-
 Libya
-
 Lithuania
-
 Luxembourg
-
 Madagascar
-
 Malaysia
-
 Malta
-
 Mauritius
-
 Mexico
-
 Moldova
-
 Mongolia
-
 Montenegro
-
 Morocco
-
 Mozambique
-
 Myanmar
-
 Namibia
-
 Nepal
-
 Netherlands
-
 New Zealand
-
 Nigeria
-
 North Macedonia
-
 Norway
-
 Oman
-
 Pakistan
-
 Palestine
-
 Panama
-
 Papua New Guinea
-
 Paraguay
-
 Peru
-
 Philippines
-
 Poland
-
 Portugal
-
 Puerto Rico
-
 Qatar
-
 Reunion
-
 Romania
-
 Rwanda
-
 Saudi Arabia
-
 Serbia
-
 Singapore
-
 Slovakia
-
 Slovenia
-
 Somalia
-
 South Africa
-
 Spain
-
 Sri Lanka
-
 Sweden
-
 Switzerland
-
 Syria
-
 Taiwan
-
 Tajikistan
-
 Tanzania
-
 Thailand
-
 Trinidad and Tobago
-
 Tunisia
-
 Turkey
-
 UAE
-
 Uganda
-
 Ukraine
-
 United Kingdom
-
United States
-
 Uruguay
-
 Uzbekistan
-
 Venezuela
-
 Vietnam
-
 Yemen
-
 Zambia
-
 Zimbabwe
- Forex
- Crypto












