

What's behind Quant's latest 10.4% price surge?

Quant (QNT) surged 10.36% as renewed buying interest followed active spot market accumulation by long-term investors in the $150–$155 range. The rally looks limited, with QNT/USD still trading below both its 20-day and 50-day moving averages.
 158.13
203.860000
Highlights
- Quant experienced reduced open interest in derivatives with most liquidations from long positions, signaling active repositioning among traders.
- Long-term participants repeatedly placed buy orders near $150 to $155, indicating persistent demand at lower price levels.
- QNT/USD trades below key short-term moving averages, with indicators showing downside momentum and an expected five-day range of $116.43 to $187.212.
Long liquidations rise amid steady demand from strategic investors
Quant has seen notable derivative activity in recent sessions, with a decline in open interest and a majority of liquidations coming from long positions. At least one long-term investor reportedly purchased QNT at $155 and placed further buy orders near $150, indicating consistent demand at lower levels. References to potential future developments and speculative scenarios have emerged, but only recent market activity and trading levels are confirmed.
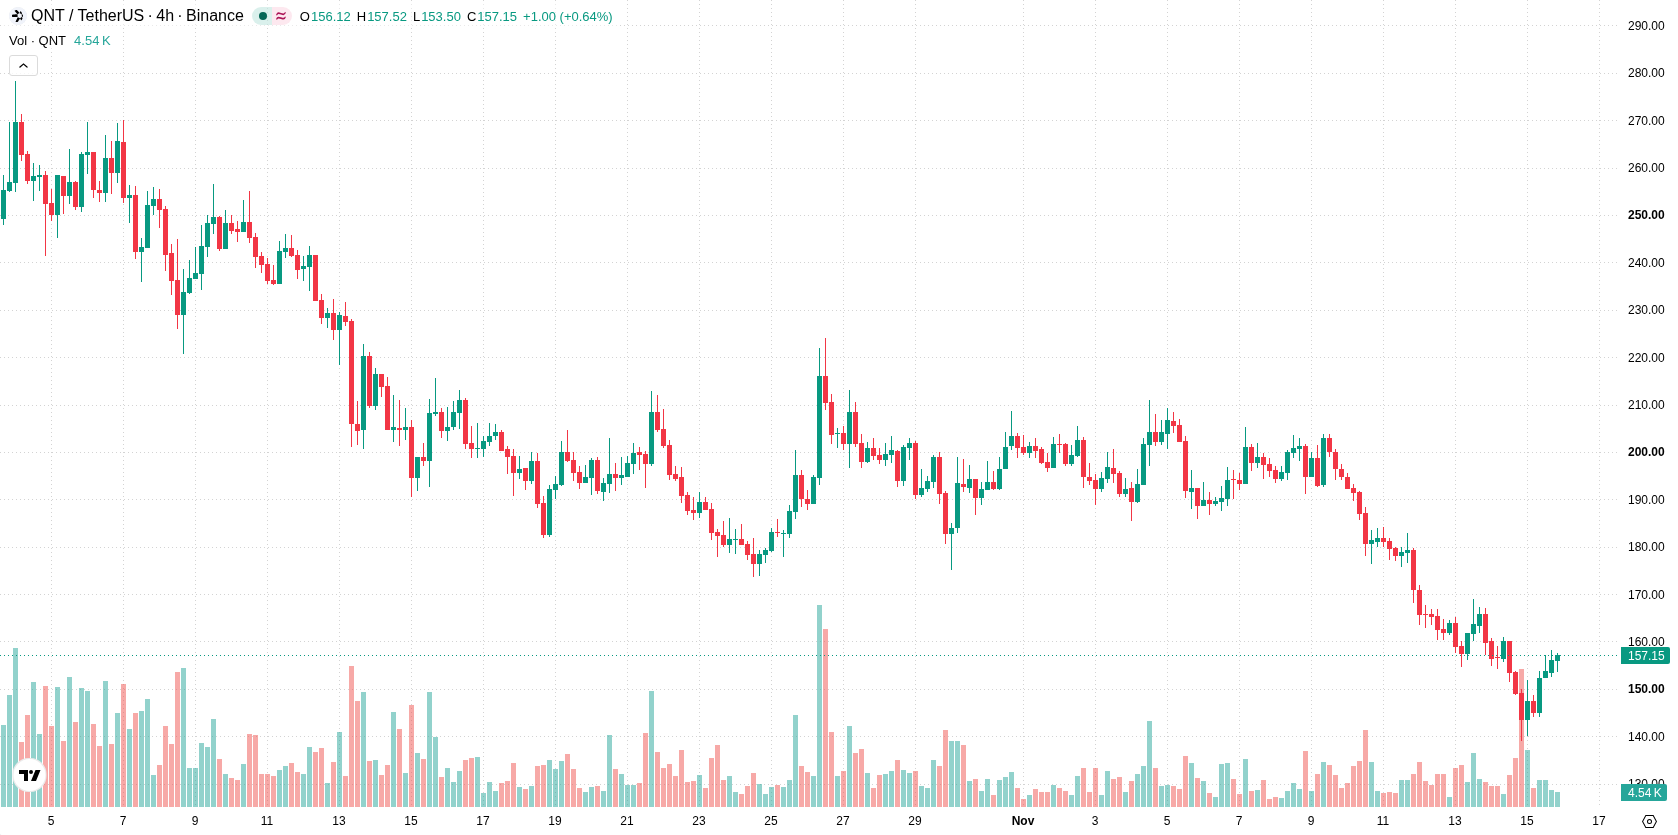
Technical resistance holds as momentum indicators flag short-term exhaustion
QNT/USD is trading below its 20-day and 50-day moving averages at $188.411 and $210.1072, while remaining well above the longer-term 200-day moving average at $102.7998, maintaining a constructive long-term tone supported by a bullish MA-50 vs MA-200 alignment. Immediate resistance stands at $158.13, with support near $140.05. Momentum readings are mixed: the MACD and Awesome Oscillator signal downside pressure, reflecting ongoing selling momentum. The RSI is neutral, while the Stochastic RSI and Commodity Channel Index are both in the oversold zone, indicating possible short-term exhaustion. Sellers still dominate short-term intraday momentum as evidenced by negative Bull/Bear Power readings. The pair rose $14.65 (10.36%) on the day, following an upside gap of $2.22 (1.57%), with the price holding near the day's high. Intraday volatility measures 12.91%. Session highs reflect resilience, despite short-term momentum skewed toward sellers.
Earlier, analysts noted that Quant was building upside momentum amid growing derivatives availability and shifting technical signals. With sellers now asserting short-term control despite resilient intraday highs, traders should monitor the $158.13 resistance for any change in direction, as a decisive move above this level could alter the prevailing consolidation scenario.






Latest Quant News




-
 Afghanistan
-
 Albania
-
 Algeria
-
 Angola
-
 Argentina
-
 Armenia
-
 Australia
-
 Austria
-
 Azerbaijan
-
 Bahamas
-
 Bahrain
-
 Bangladesh
-
 Belarus
-
 Belgium
-
 Bolivia
-
 Botswana
-
 Brazil
-
 Brunei
-
 Bulgaria
-
 Cambodia
-
 Cameroon
-
 Canada
-
 Chile
-
 China
-
 Colombia
-
 Congo
-
 Costa Rica
-
 Cote d'Ivoire
-
 Croatia
-
 Cuba
-
 Cyprus
-
 Czechia
-
 DR Congo
-
 Denmark
-
 Dominican Republic
-
 Ecuador
-
 Egypt
-
 El Salvador
-
 Estonia
-
 Eswatini
-
 Ethiopia
-
 Finland
-
 France
-
 Georgia
-
 Germany
-
 Ghana
-
 Greece
-
 Haiti
-
 Hong Kong
-
 Hungary
-
 India
-
 Indonesia
-
 Iran, Islamic republic
-
 Iraq
-
 Ireland
-
 Israel
-
 Italy
-
 Jamaica
-
 Japan
-
 Jordan
-
 Kazakhstan
-
 Kenya
-
 Korea
-
 Kuwait
-
 Kyrgyzstan
-
 Laos
-
 Latvia
-
 Lebanon
-
 Lesotho
-
 Libya
-
 Lithuania
-
 Luxembourg
-
 Madagascar
-
 Malaysia
-
 Malta
-
 Mauritius
-
 Mexico
-
 Moldova
-
 Mongolia
-
 Montenegro
-
 Morocco
-
 Mozambique
-
 Myanmar
-
 Namibia
-
 Nepal
-
 Netherlands
-
 New Zealand
-
 Nigeria
-
 North Macedonia
-
 Norway
-
 Oman
-
 Pakistan
-
 Palestine
-
 Panama
-
 Papua New Guinea
-
 Paraguay
-
 Peru
-
 Philippines
-
 Poland
-
 Portugal
-
 Puerto Rico
-
 Qatar
-
 Reunion
-
 Romania
-
 Rwanda
-
 Saudi Arabia
-
 Serbia
-
 Singapore
-
 Slovakia
-
 Slovenia
-
 Somalia
-
 South Africa
-
 Spain
-
 Sri Lanka
-
 Sweden
-
 Switzerland
-
 Syria
-
 Taiwan
-
 Tajikistan
-
 Tanzania
-
 Thailand
-
 Trinidad and Tobago
-
 Tunisia
-
 Turkey
-
 UAE
-
 Uganda
-
 Ukraine
-
 United Kingdom
-
United States
-
 Uruguay
-
 Uzbekistan
-
 Venezuela
-
 Vietnam
-
 Yemen
-
 Zambia
-
 Zimbabwe
- Forex
- Crypto












