

ETF fund withdrawals deepen liquidity concerns for XRP and peers across the crypto sector

XRP (XRP) is trading higher, with participants watching for broader crypto capital flows as ETF outflows and stablecoin contraction continue to shape sentiment. Short-term positioning on the charts remains a focus as traders weigh potential liquidity constraints.
 0.9747
1.1063
Highlights
- XRP reached its lowest price since November 2024 after significant outflows from crypto ETFs and a declining stablecoin market cap affected major cryptocurrencies.
- Diminishing capital from ETF outflows and reduced stablecoin supply limited liquidity across digital assets and exerted broad selling pressure.
- Technically, XRP trades below key moving averages with bearish momentum, and a sustained move above $0.99 is needed to challenge current downside risks.
ETF outflows and stablecoin contraction pressure XRP and peers
According to CoinDesk, on November 15, 2026, XRP fell to its lowest level since November 2024 due to large outflows from crypto ETFs and a shrinking stablecoin market cap, an event that also affected Bitcoin, Ether, and other major cryptocurrencies.
This outflow from ETFs and the reduction in stablecoin supply reduced capital available for trading and investment across the digital asset sector, placing pressure on prices via diminished liquidity and risk appetite.
While this event introduced a wave of selling pressure, the direct impact aligned with widespread market moves rather than asset-specific developments, highlighting the broader market sensitivity to funding and liquidity shifts.
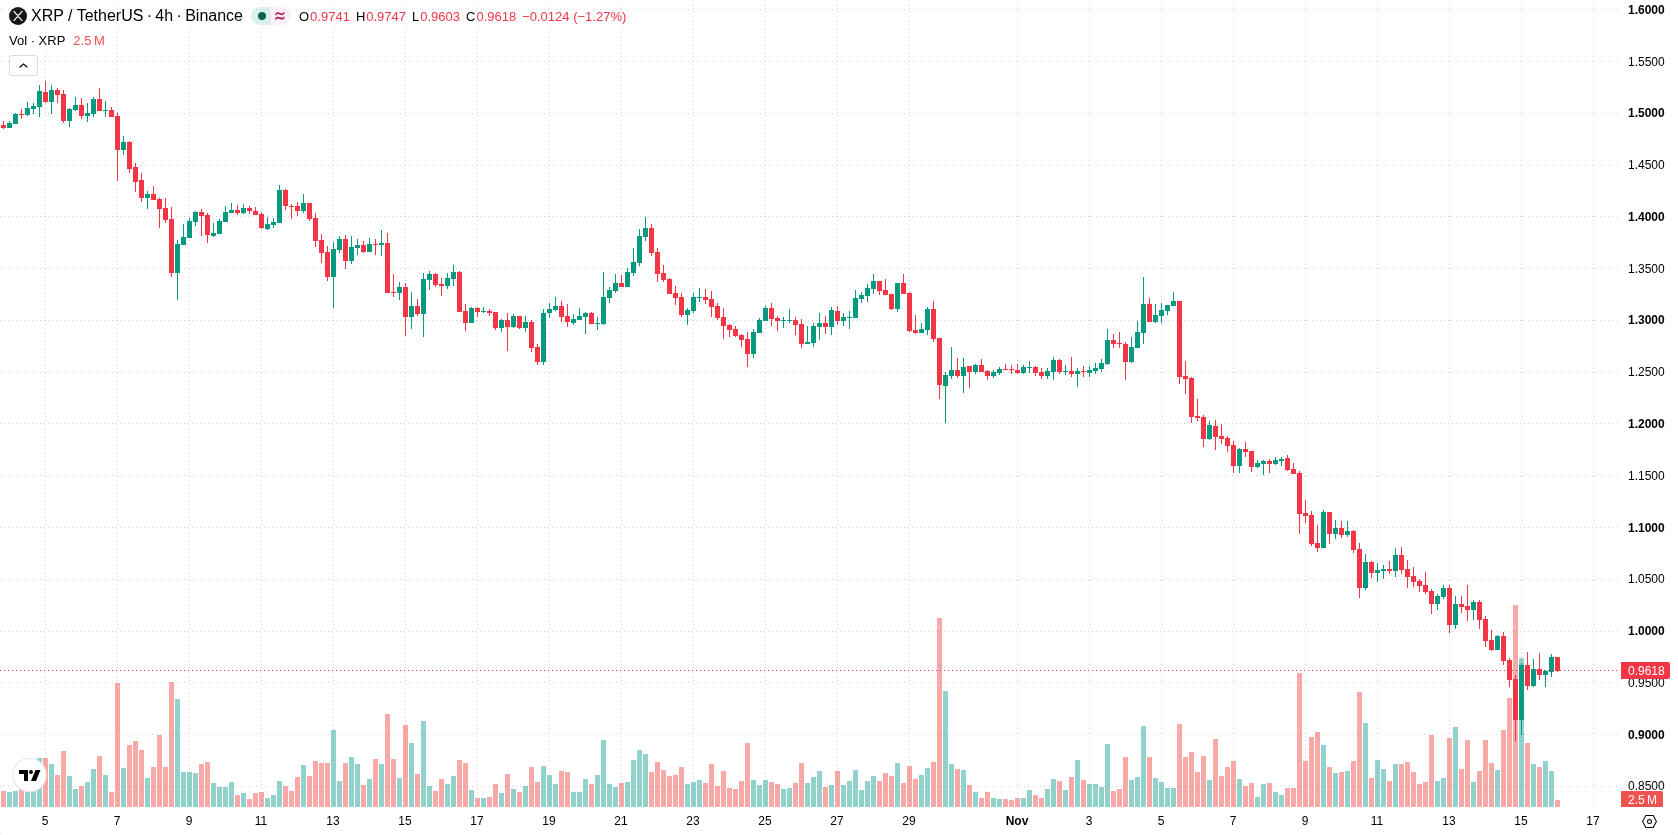
Ongoing downside risk below major 4H moving averages
From a technical perspective, XRP remains below key moving averages on the 4H chart, underscoring ongoing downside risk after last week's macro-driven decline. The asset is currently positioned under both the 50-period and 200-period 4H simple moving averages, while the H4 Ichimoku Kijun acts as nearby resistance.
Directional indicators are bearish, with MACD and ADX supplying strong sell signals. This suggests momentum remains to the downside unless the asset can break through the resistance level identified by the Kijun.
Capital trends and resistance near $0.99 define short-term risk
Ongoing monitoring of ETF fund flows and changes in stablecoin supply is crucial, as further capital outflows could increase market vulnerability for XRP and peers. A sustained move above the area around $0.99 would be needed to challenge this bearish setup. If major capital returns to the sector, price stabilization could follow, but short-term risks remain tied to liquidity trends.
Earlier, analysts noted that XRP was facing sustained selling pressure and elevated downside risk amid persistent ETF outflows and uncertain technical signals. The current article reinforces this cautious backdrop, emphasizing that ongoing monitoring of ETF fund flows and stablecoin supply remains critical for any potential shift in price direction.






Latest XRP News





-
 Afghanistan
-
 Albania
-
 Algeria
-
 Angola
-
 Argentina
-
 Armenia
-
 Australia
-
 Austria
-
 Azerbaijan
-
 Bahamas
-
 Bahrain
-
 Bangladesh
-
 Belarus
-
 Belgium
-
 Bolivia
-
 Botswana
-
 Brazil
-
 Brunei
-
 Bulgaria
-
 Cambodia
-
 Cameroon
-
 Canada
-
 Chile
-
 China
-
 Colombia
-
 Congo
-
 Costa Rica
-
 Cote d'Ivoire
-
 Croatia
-
 Cuba
-
 Cyprus
-
 Czechia
-
 DR Congo
-
 Denmark
-
 Dominican Republic
-
 Ecuador
-
 Egypt
-
 El Salvador
-
 Estonia
-
 Eswatini
-
 Ethiopia
-
 Finland
-
 France
-
 Georgia
-
 Germany
-
 Ghana
-
 Greece
-
 Haiti
-
 Hong Kong
-
 Hungary
-
 India
-
 Indonesia
-
 Iran, Islamic republic
-
 Iraq
-
 Ireland
-
 Israel
-
 Italy
-
 Jamaica
-
 Japan
-
 Jordan
-
 Kazakhstan
-
 Kenya
-
 Korea
-
 Kuwait
-
 Kyrgyzstan
-
 Laos
-
 Latvia
-
 Lebanon
-
 Lesotho
-
 Libya
-
 Lithuania
-
 Luxembourg
-
 Madagascar
-
 Malaysia
-
 Malta
-
 Mauritius
-
 Mexico
-
 Moldova
-
 Mongolia
-
 Montenegro
-
 Morocco
-
 Mozambique
-
 Myanmar
-
 Namibia
-
 Nepal
-
 Netherlands
-
 New Zealand
-
 Nigeria
-
 North Macedonia
-
 Norway
-
 Oman
-
 Pakistan
-
 Palestine
-
 Panama
-
 Papua New Guinea
-
 Paraguay
-
 Peru
-
 Philippines
-
 Poland
-
 Portugal
-
 Puerto Rico
-
 Qatar
-
 Reunion
-
 Romania
-
 Rwanda
-
 Saudi Arabia
-
 Serbia
-
 Singapore
-
 Slovakia
-
 Slovenia
-
 Somalia
-
 South Africa
-
 Spain
-
 Sri Lanka
-
 Sweden
-
 Switzerland
-
 Syria
-
 Taiwan
-
 Tajikistan
-
 Tanzania
-
 Thailand
-
 Trinidad and Tobago
-
 Tunisia
-
 Turkey
-
 UAE
-
 Uganda
-
 Ukraine
-
 United Kingdom
-
United States
-
 Uruguay
-
 Uzbekistan
-
 Venezuela
-
 Vietnam
-
 Yemen
-
 Zambia
-
 Zimbabwe
- Forex
- Crypto












