

Optimism technical analysis: Downward price move persists as seller pressure dominates

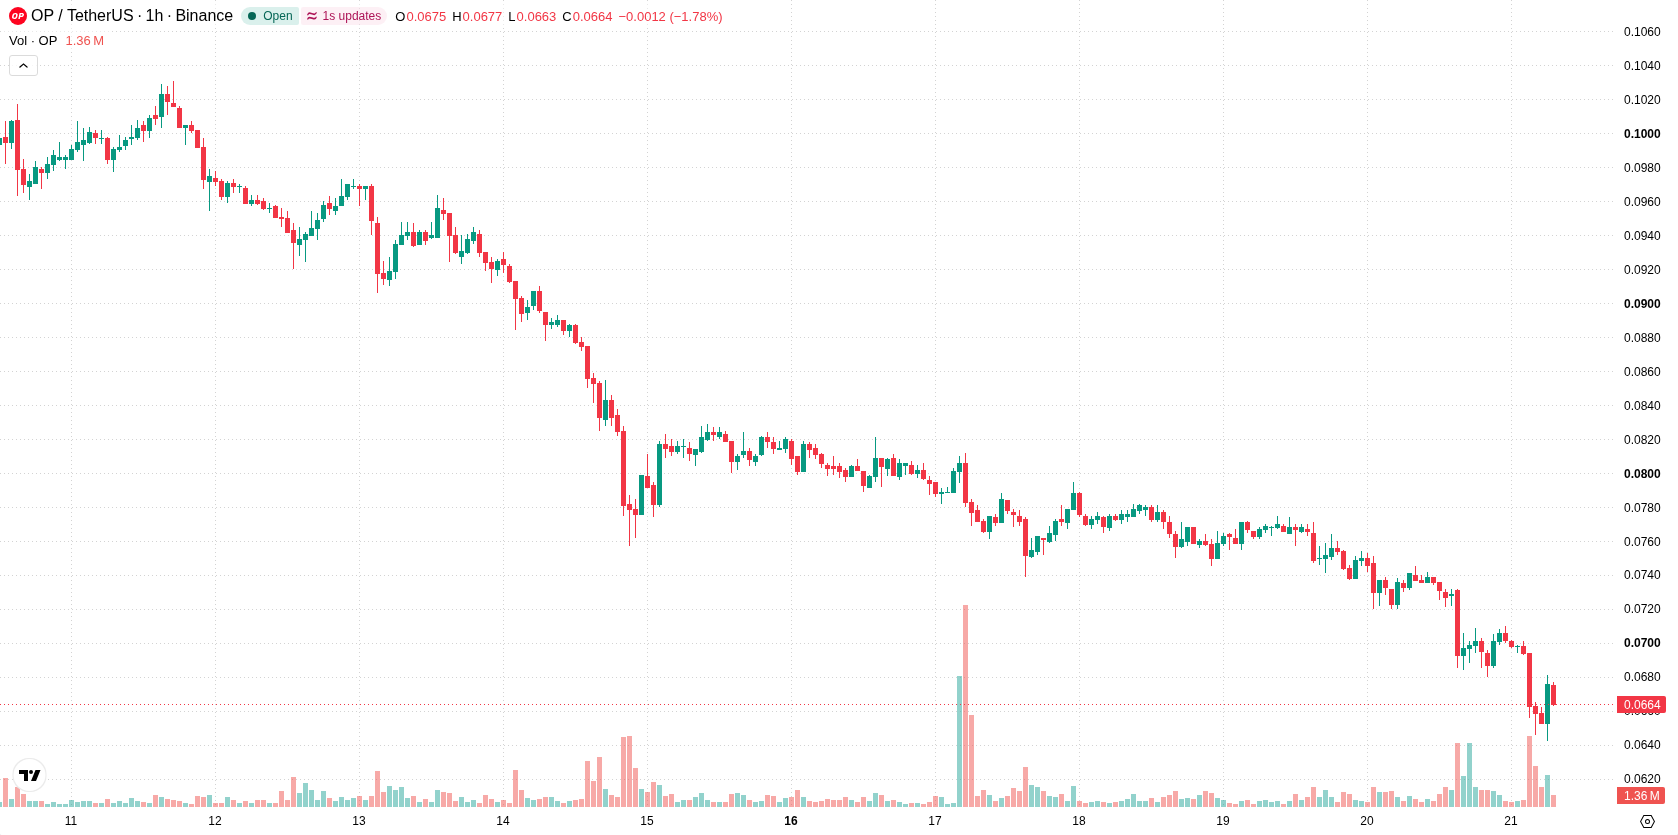
Optimism (OP) is trading at $0.067, marking a daily decline of 8.97%. The asset is currently positioned below its key short-term and longer-term moving averages, with the price exhibiting sustained downward momentum.
 0.0708
0.0821
Highlights
- OP/USD trades under key moving averages with price now at $0.067, down 8.97% amid high volatility.
- Momentum indicators remain bearish with sustained seller control, though multiple oscillators show extreme oversold conditions.
- Expected 1-day range is $0.057 to $0.0703 with a 74% likelihood of further downside unless a technical rebound occurs.
Bearish pressure and oversold signals amid heightened volatility
On the technical front, OP/USD trades below the H1 SMA-20 at $0.0696 and the H1 SMA-50 at $0.0729, highlighting persistent short- and medium-term bearish pressure. The price also sits beneath the D1 SMA-200 at $0.1094, and the Ichimoku Kijun on the H1 timeframe aligns with immediate resistance at $0.0696. Momentum indicators reinforce a bearish tone: both MACD and ADX signal a sell bias, while Bull/Bear Power registers negative at -0.0028 and the Awesome Oscillator also points lower. Oscillators—including RSI, Stoch RSI, and CCI—have all entered oversold zones, suggesting potential conditions for a technical rebound despite prevailing downward force. The price remains near the middle of today’s intraday range amid heightened volatility.
Downside favored as probabilities skew bearish for next session
Looking ahead to the next trading day, OP/USD is expected to fluctuate within a band from $0.057 to $0.0703. Statistical analysis assigns a 26% probability to an upward move and a 74% chance of further downside. Price stabilization would likely lead to sideways action inside this range, while a break above resistance at $0.0696 could trigger a short-term bounce. Should selling persist, a move below $0.057 would open the way for new lows within the current volatility environment.
Earlier, analysts noted that Optimism was experiencing persistent downside momentum and heightened technical pressure. The latest market action reinforces this bearish outlook, with continued weakness suggesting traders should monitor the $0.057 support level as a threshold for further declines in the near term.










-
 Afghanistan
-
 Albania
-
 Algeria
-
 Angola
-
 Argentina
-
 Armenia
-
 Australia
-
 Austria
-
 Azerbaijan
-
 Bahamas
-
 Bahrain
-
 Bangladesh
-
 Belarus
-
 Belgium
-
 Bolivia
-
 Botswana
-
 Brazil
-
 Brunei
-
 Bulgaria
-
 Cambodia
-
 Cameroon
-
 Canada
-
 Chile
-
 China
-
 Colombia
-
 Congo
-
 Costa Rica
-
 Cote d'Ivoire
-
 Croatia
-
 Cuba
-
 Cyprus
-
 Czechia
-
 DR Congo
-
 Denmark
-
 Dominican Republic
-
 Ecuador
-
 Egypt
-
 El Salvador
-
 Estonia
-
 Eswatini
-
 Ethiopia
-
 Finland
-
 France
-
 Georgia
-
 Germany
-
 Ghana
-
 Greece
-
 Haiti
-
 Hong Kong
-
 Hungary
-
 India
-
 Indonesia
-
 Iran, Islamic republic
-
 Iraq
-
 Ireland
-
 Israel
-
 Italy
-
 Jamaica
-
 Japan
-
 Jordan
-
 Kazakhstan
-
 Kenya
-
 Korea
-
 Kuwait
-
 Kyrgyzstan
-
 Laos
-
 Latvia
-
 Lebanon
-
 Lesotho
-
 Libya
-
 Lithuania
-
 Luxembourg
-
 Madagascar
-
 Malaysia
-
 Malta
-
 Mauritius
-
 Mexico
-
 Moldova
-
 Mongolia
-
 Montenegro
-
 Morocco
-
 Mozambique
-
 Myanmar
-
 Namibia
-
 Nepal
-
 Netherlands
-
 New Zealand
-
 Nigeria
-
 North Macedonia
-
 Norway
-
 Oman
-
 Pakistan
-
 Palestine
-
 Panama
-
 Papua New Guinea
-
 Paraguay
-
 Peru
-
 Philippines
-
 Poland
-
 Portugal
-
 Puerto Rico
-
 Qatar
-
 Reunion
-
 Romania
-
 Rwanda
-
 Saudi Arabia
-
 Serbia
-
 Singapore
-
 Slovakia
-
 Slovenia
-
 Somalia
-
 South Africa
-
 Spain
-
 Sri Lanka
-
 Sweden
-
 Switzerland
-
 Syria
-
 Taiwan
-
 Tajikistan
-
 Tanzania
-
 Thailand
-
 Trinidad and Tobago
-
 Tunisia
-
 Turkey
-
 UAE
-
 Uganda
-
 Ukraine
-
 United Kingdom
-
United States
-
 Uruguay
-
 Uzbekistan
-
 Venezuela
-
 Vietnam
-
 Yemen
-
 Zambia
-
 Zimbabwe
- Forex
- Crypto












