

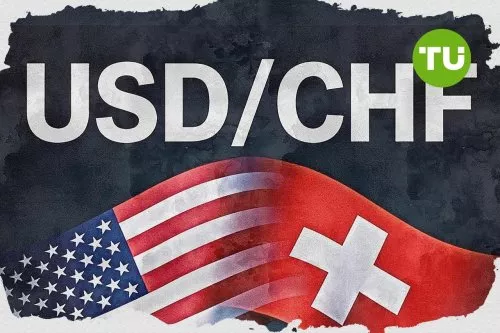
USD/CHF trades flat as Fed may prolong restrictive monetary policy

US Dollar vs Swiss Franc (USD/CHF) is trading at Fr.0.8057, finishing the session higher and posting a daily gain of 0.54%. The pair remains positioned above its key moving averages, reflecting a continuation of the recent upward momentum.
 0.8275
0.8395
0.8275
0.8395
Highlights
- US Dollar strength continued as traders focus on upcoming US PCE inflation data, the Federal Reserve's main inflation measure.
- Markets expect higher PCE readings could support prolonged restrictive monetary policy and add demand for the US Dollar.
- USD/CHF trades with a strong bullish technical structure and is expected to consolidate within Fr.0.8017 to Fr.0.8097 over the next 2 to 3 days.
Anticipatory inflows rise as investors await US inflation data
The US Dollar saw renewed strength, fueling gains in USD/CHF as attention shifted to the upcoming US Personal Consumption Expenditures (PCE) inflation data, which serves as the Federal Reserve’s principal inflation gauge, according to Fxstreet. Market participants view heightened US PCE readings as a signal that could lead to prolonged restrictive monetary policy, thereby supporting additional demand for the US Dollar. This anticipatory positioning has contributed to the pair’s upward momentum despite ongoing uncertainty around Fed policy direction.
Bullish signals across timeframes as oscillators show overbought risk
On the technical front, USD/CHF closed above the MA-20 and MA-50 on the hourly chart, and remains above the MA-200 on the daily timeframe, reinforcing a bullish framework across multiple time horizons. The Ichimoku Kijun on the daily chart offers immediate support at Fr.0.8032. Momentum indicators present a constructive outlook, with both MACD and Awesome Oscillator issuing strong buy signals, while ADX remains neutral. However, oscillators reveal overbought conditions: RSI is hovering near its upper threshold with a buy signal, and both Stoch RSI and CCI indicate an overextended market. Bull/Bear Power further confirms buyer control on an intraday basis, suggesting a sustained buying bias, though stretched oscillator readings warn of potential divergence and the need for caution.
Sideways consolidation likely as breakout risks skew to upside
Looking ahead to the next 2-3 trading days, USD/CHF is expected to trade within a range of Fr.0.8017 to Fr.0.8097, reflecting typical volatility relative to current levels. The baseline scenario envisions a period of sideways consolidation within this band. A bullish breakout above resistance would likely propel the pair higher, while a drop below the Fr.0.8032 support could lead to a move toward the lower boundary of the identified corridor. The probability of further gains is assessed as very high, with a very low likelihood of reversal in the immediate term.
Previously it was reported that concerns over U.S. fiscal stability and Treasury interventions were weighing on long-dated government bonds and the U.S. dollar. With the latest technical and macroeconomic signals now favoring USD/CHF strength, traders should monitor for a potential shift in volatility as U.S. PCE inflation data approaches, which could challenge the current bullish range.










-
 Afghanistan
-
 Albania
-
 Algeria
-
 Angola
-
 Argentina
-
 Armenia
-
 Australia
-
 Austria
-
 Azerbaijan
-
 Bahamas
-
 Bahrain
-
 Bangladesh
-
 Belarus
-
 Belgium
-
 Bolivia
-
 Botswana
-
 Brazil
-
 Brunei
-
 Bulgaria
-
 Cambodia
-
 Cameroon
-
 Canada
-
 Chile
Chile
-
 China
China
-
 Colombia
-
 Congo
Congo
-
 Costa Rica
-
 Cote d'Ivoire
-
 Croatia
-
 Cuba
Cuba
-
 Cyprus
-
 Czechia
-
 DR Congo
-
 Denmark
-
 Dominican Republic
-
 Ecuador
-
 Egypt
Egypt
-
 El Salvador
-
 Estonia
-
 Eswatini
-
 Ethiopia
-
 Finland
-
 France
-
 Georgia
-
 Germany
-
 Ghana
Ghana
-
 Greece
-
 Haiti
Haiti
-
 Hong Kong
-
 Hungary
-
 India
India
-
 Indonesia
-
 Iran, Islamic republic
-
 Iraq
Iraq
-
 Ireland
-
 Israel
-
 Italy
Italy
-
 Jamaica
-
 Japan
Japan
-
 Jordan
-
 Kazakhstan
-
 Kenya
Kenya
-
 Korea
Korea
-
 Kuwait
-
 Kyrgyzstan
-
 Laos
Laos
-
 Latvia
-
 Lebanon
-
 Lesotho
-
 Libya
Libya
-
 Lithuania
-
 Luxembourg
-
 Madagascar
-
 Malaysia
-
 Malta
Malta
-
 Mauritius
-
 Mexico
-
 Moldova
-
 Mongolia
-
 Montenegro
-
 Morocco
-
 Mozambique
-
 Myanmar
-
 Namibia
-
 Nepal
Nepal
-
 Netherlands
-
 New Zealand
-
 Nigeria
-
 North Macedonia
-
 Norway
-
 Oman
Oman
-
 Pakistan
-
 Palestine
-
 Panama
-
 Papua New Guinea
-
 Paraguay
-
 Peru
Peru
-
 Philippines
-
 Poland
-
 Portugal
-
 Puerto Rico
-
 Qatar
Qatar
-
 Reunion
-
 Romania
-
 Rwanda
-
 Saudi Arabia
-
 Serbia
-
 Singapore
-
 Slovakia
-
 Slovenia
-
 Somalia
-
 South Africa
-
 Spain
Spain
-
 Sri Lanka
-
 Sweden
-
 Switzerland
-
 Syria
Syria
-
 Taiwan
-
 Tajikistan
-
 Tanzania
-
 Thailand
-
 Trinidad and Tobago
-
 Tunisia
-
 Turkey
-
 UAE
UAE
-
 Uganda
-
 Ukraine
-
 United Kingdom
-
United States
-
 Uruguay
-
 Uzbekistan
-
 Venezuela
-
 Vietnam
-
 Yemen
Yemen
-
 Zambia
-
 Zimbabwe
- Forex
- Crypto












