

USD/UZS technical analysis: Weak momentum and resistance at UZS12,016 cap upside

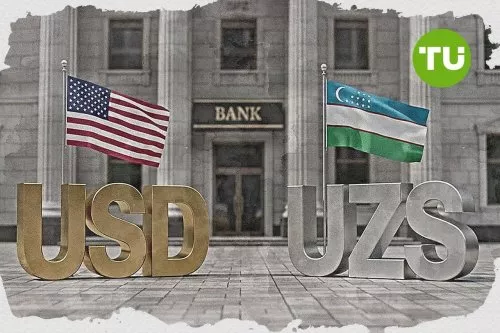
US Dollar vs Uzbekistan Som (USD/UZS) is trading at UZS11,970, recording a modest decline for the day. The pair remains positioned below its key moving averages, indicating a continuation of recent bearish market sentiment.
 12059.76
12092.62
Highlights
- Uzbekistan commercial bank assets rose 20.5% year-on-year to 1,044.8 trillion soums by October 1, 2026, as private banking and securities investment expanded.
- Expanding banking sector liquidity could influence domestic capital availability and shift demand for foreign currency, impacting USD/UZS dynamics.
- USD/UZS continued to face downside pressure, trading below key averages with bearish momentum, and is expected to stay between UZS11,910 to UZS12,030 over the next 2 to 3 days.
Bank asset surge supports liquidity amid rising private investment
Uzbekistan's commercial bank assets expanded by 20.5% year-on-year to 1,044.8 trillion soums as of October 1, 2026, driven by growth in private banking and heightened securities investment, according to Uzdaily. This increase signals ongoing expansion within Uzbekistan's financial sector, supporting broader liquidity in the local market. Higher banking assets can enhance capital availability and alter domestic demand for foreign currency, potentially affecting the dynamics of the US Dollar vs Uzbekistan Som forex pair.
Seller dominance as price and momentum indicators breach support
On the technical front, USD/UZS is trading below the MA-20 at UZS12,031 and MA-50 at UZS12,023 on the hourly chart, as well as below the MA-200 at UZS11,989 on the daily chart. Ichimoku Kijun at UZS12,016 acts as the nearest resistance. Momentum indicators highlight continued selling strength: MACD remains in sell territory, while ADX shows a neutral stance, indicating a lack of decisive trend strength. RSI is at 42.74 with a sell signal; both CCI and Bull/Bear Power are in oversold territory, confirming intraday seller dominance. Stoch RSI provides a neutral read, reflecting short-term uncertainty, while the Awesome Oscillator aligns with the overall bearish bias.
Range-bound trading anticipated as resistance and risk levels defined
Near term, USD/UZS is expected to trade within a band of UZS11,910 to UZS12,030 over the next two to three days, reflecting typical volatility for the pair. A move above resistance at UZS12,016 would point toward a bullish retracement, opening scope for recovery. On the downside, a break below UZS11,910 risks exposing new lows for the pair. The baseline scenario still favors a range-bound dynamic within these levels.
Earlier, analysts noted that US Dollar vs Uzbekistan Som maintained a bullish bias, supported by persistent buying interest and strong technical signals. The latest data showing renewed bearish pressure and oversold technical conditions signals a potential shift, making a move above UZS12,016 the key level to watch for any reversal in the near term.






Latest USD/UZS News


-
 Afghanistan
-
 Albania
-
 Algeria
-
 Angola
-
 Argentina
-
 Armenia
-
 Australia
-
 Austria
-
 Azerbaijan
-
 Bahamas
-
 Bahrain
-
 Bangladesh
-
 Belarus
-
 Belgium
-
 Bolivia
-
 Botswana
-
 Brazil
-
 Brunei
-
 Bulgaria
-
 Cambodia
-
 Cameroon
-
 Canada
-
 Chile
-
 China
-
 Colombia
-
 Congo
-
 Costa Rica
-
 Cote d'Ivoire
-
 Croatia
-
 Cuba
-
 Cyprus
-
 Czechia
-
 DR Congo
-
 Denmark
-
 Dominican Republic
-
 Ecuador
-
 Egypt
-
 El Salvador
-
 Estonia
-
 Eswatini
-
 Ethiopia
-
 Finland
-
 France
-
 Georgia
-
 Germany
-
 Ghana
-
 Greece
-
 Haiti
-
 Hong Kong
-
 Hungary
-
 India
-
 Indonesia
-
 Iran, Islamic republic
-
 Iraq
-
 Ireland
-
 Israel
-
 Italy
-
 Jamaica
-
 Japan
-
 Jordan
-
 Kazakhstan
-
 Kenya
-
 Korea
-
 Kuwait
-
 Kyrgyzstan
-
 Laos
-
 Latvia
-
 Lebanon
-
 Lesotho
-
 Libya
-
 Lithuania
-
 Luxembourg
-
 Madagascar
-
 Malaysia
-
 Malta
-
 Mauritius
-
 Mexico
-
 Moldova
-
 Mongolia
-
 Montenegro
-
 Morocco
-
 Mozambique
-
 Myanmar
-
 Namibia
-
 Nepal
-
 Netherlands
-
 New Zealand
-
 Nigeria
-
 North Macedonia
-
 Norway
-
 Oman
-
 Pakistan
-
 Palestine
-
 Panama
-
 Papua New Guinea
-
 Paraguay
-
 Peru
-
 Philippines
-
 Poland
-
 Portugal
-
 Puerto Rico
-
 Qatar
-
 Reunion
-
 Romania
-
 Rwanda
-
 Saudi Arabia
-
 Serbia
-
 Singapore
-
 Slovakia
-
 Slovenia
-
 Somalia
-
 South Africa
-
 Spain
-
 Sri Lanka
-
 Sweden
-
 Switzerland
-
 Syria
-
 Taiwan
-
 Tajikistan
-
 Tanzania
-
 Thailand
-
 Trinidad and Tobago
-
 Tunisia
-
 Turkey
-
 UAE
-
 Uganda
-
 Ukraine
-
 United Kingdom
-
United States
-
 Uruguay
-
 Uzbekistan
-
 Venezuela
-
 Vietnam
-
 Yemen
-
 Zambia
-
 Zimbabwe
- Forex
- Crypto












