
Gold price hovers near $5,000 as dollar firms and holiday liquidity thins

Gold (XAU/USD) hovered near $5,002 per ounce on February 16 as the market slipped back toward the $5,000 psychological mark after failing to extend last week’s rebound. The pullback has been framed by a firmer U.S. dollar and thinner liquidity tied to holiday closures.
Highlights
- XAU/USD eased roughly 0.4% on February 16 and is consolidating around the $5,000 handle after a volatile first half of February.
- A stronger dollar and holiday-thinned liquidity have been the immediate headwinds, keeping price action more technical than headline-driven.
- The technical posture is mixed: RSI is neutral near 50, volatility is modest by recent standards, and price is testing a tight cluster of key moving averages.
Technically, gold is stuck in a compression zone where mean reversion and trend support meet in a narrow band. The daily trend gauges show the 20-day SMA at 5,010.59, the 50-day SMA at 4,994.24, and the 200-day SMA at 4,989.74.
With spot hovering just under the 20-day and only modestly above the 50- and 200-day, traders are effectively debating whether the dip is a routine retest of trend support or the start of a deeper unwind. When averages bunch up around a psychological handle like $5,000, the market tends to produce quick reversals and false breaks until a catalyst restores directional conviction.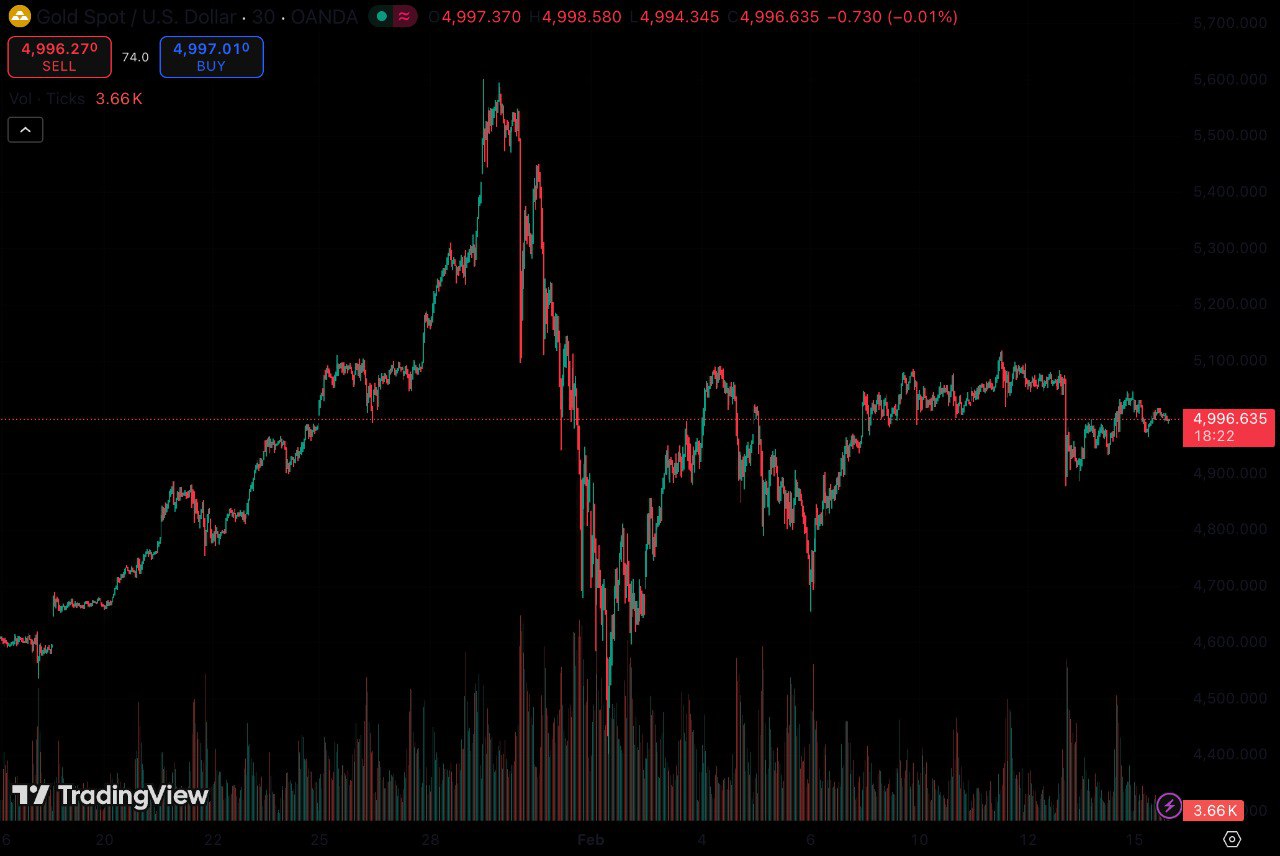
Gold price dynamics (January - February 2026) Source: TradingView.
Momentum is not yet confirming a decisive impulse. RSI(14) was 49.718, consistent with two-way trade, while MACD(12,26) printed 1.71, indicating only mild positive momentum. Volatility is also relatively contained: ATR(14) was 20.5022, implying a typical daily swing near $20 and setting realistic 24–72 hour objectives. For levels, first support sits at $4,960–$4,970, built around the Feb. 16 low at 4,966.51, while a deeper floor is $4,880–$4,900, anchored by the Feb. 12–13 swing lows at 4,879.05 and 4,888.71. Resistance is $5,010–$5,020 first, then $5,080–$5,120.
Macro backdrop and positioning watch
The near-term narrative has been shaped as much by liquidity as by macro headlines. Reuters reported that thin trading linked to U.S. holiday closures and Lunar New Year holidays in parts of Asia can reduce depth and widen spreads, making prices more sensitive to incremental flows and technical magnets. In that environment, $5,000 becomes a focal point for stop placement and options hedging, which can exaggerate intraday probes above and below the figure. The practical result is a market that can look jumpy even when the broader macro tape is quiet, with traders defaulting to nearby swing points and moving averages as risk controls.A firmer dollar remains the cleanest day-to-day headwind because it raises the non-U.S. cost of bullion. The U.S. Dollar Index is around 96.96, up roughly 0.15%, reinforcing FX as the immediate transmission channel for the pullback. Moreover, there is an uncertainty around the U.S. policy outlook, with the Federal Reserve expected to keep rates steady at its next meeting amid mixed signals, leaving gold reactive to shifts in yields and rate expectations. Until the dollar and rates backdrop points clearly in one direction, traders are likely to keep fading moves at well-advertised levels.
Price scenarios and short-term forecast
In a bullish 24–72 hour scenario, buyers need to reclaim $5,010–$5,020 and hold it, effectively putting the spot back above the 20-day SMA at 5,010.59 and reducing whipsaw risk around $5,000. With RSI near neutral rather than stretched, a sustained push through that band could target $5,050 first, then the $5,080–$5,120 pocket where February’s prior highs sit. With ATR near $20, a one-to-two range extension over two sessions is plausible if the dollar softens and momentum firms, but the market likely needs a daily close above $5,020 to validate a breakout attempt.The base case is consolidation between $4,960–$4,970 support and $5,010–$5,020 resistance, with the 50- and 200-day averages just below spot acting as a cushion if dips remain orderly. A bearish scenario strengthens if gold closes below $4,960–$4,970, turning that zone into resistance and exposing the deeper $4,880–$4,900 support band. Confirmation would come from momentum fading—RSI slipping into the mid-40s alongside a weakening MACD—paired with a continued bid in the dollar. In that setup, rebounds toward $5,000 could remain sellable until the price stabilizes near the lower support zone.
Meanwhile, gold and silver are entering a more fragile phase after a sharp rally. With momentum stretched, traders are watching for volatility spikes and abrupt pullback.


Latest Gold News


-
 Afghanistan
-
 Albania
-
 Algeria
-
 Angola
-
 Argentina
-
 Armenia
-
 Australia
-
 Austria
-
 Azerbaijan
-
 Bahamas
-
 Bahrain
-
 Bangladesh
-
 Belarus
-
 Belgium
-
 Bolivia
-
 Botswana
-
 Brazil
-
 Brunei
-
 Bulgaria
-
 Cambodia
-
 Cameroon
-
 Canada
-
 Chile
Chile
-
 China
China
-
 Colombia
-
 Congo
Congo
-
 Costa Rica
-
 Cote d'Ivoire
-
 Croatia
-
 Cuba
Cuba
-
 Cyprus
-
 Czechia
-
 DR Congo
-
 Denmark
-
 Dominican Republic
-
 Ecuador
-
 Egypt
Egypt
-
 El Salvador
-
 Estonia
-
 Eswatini
-
 Ethiopia
-
 Finland
-
 France
-
 Georgia
-
 Germany
-
 Ghana
Ghana
-
 Greece
-
 Haiti
Haiti
-
 Hong Kong
-
 Hungary
-
 India
India
-
 Indonesia
-
 Iran, Islamic republic
-
 Iraq
Iraq
-
 Ireland
-
 Israel
-
 Italy
Italy
-
 Jamaica
-
 Japan
Japan
-
 Jordan
-
 Kazakhstan
-
 Kenya
Kenya
-
 Korea
Korea
-
 Kuwait
-
 Kyrgyzstan
-
 Laos
Laos
-
 Latvia
-
 Lebanon
-
 Lesotho
-
 Libya
Libya
-
 Lithuania
-
 Luxembourg
-
 Madagascar
-
 Malaysia
-
 Malta
Malta
-
 Mauritius
-
 Mexico
-
 Moldova
-
 Mongolia
-
 Montenegro
-
 Morocco
-
 Mozambique
-
 Myanmar
-
 Namibia
-
 Nepal
Nepal
-
 Netherlands
-
 New Zealand
-
 Nigeria
-
 North Macedonia
-
 Norway
-
 Oman
Oman
-
 Pakistan
-
 Palestine
-
 Panama
-
 Papua New Guinea
-
 Paraguay
-
 Peru
Peru
-
 Philippines
-
 Poland
-
 Portugal
-
 Puerto Rico
-
 Qatar
Qatar
-
 Reunion
-
 Romania
-
 Rwanda
-
 Saudi Arabia
-
 Serbia
-
 Singapore
-
 Slovakia
-
 Slovenia
-
 Somalia
-
 South Africa
-
 Spain
Spain
-
 Sri Lanka
-
 Sweden
-
 Switzerland
-
 Syria
Syria
-
 Taiwan
-
 Tajikistan
-
 Tanzania
-
 Thailand
-
 Trinidad and Tobago
-
 Tunisia
-
 Turkey
-
 UAE
UAE
-
 Uganda
-
 Ukraine
-
 United Kingdom
-
United States
-
 Uruguay
-
 Uzbekistan
-
 Venezuela
-
 Vietnam
-
 Yemen
Yemen
-
 Zambia
-
 Zimbabwe
- Forex
- Crypto
