
WTI crude oil price forecast: Bulls target $68 as inventory shock fuels rally

WTI crude oil futures held just above $66 per barrel, staying near a six-month high after climbing more than 5% this week as traders repriced Middle East risk. The move follows President Donald Trump’s decision to set a 10- to 15-day deadline for Iran to advance nuclear negotiations, alongside what has been described as the largest U.S. military buildup in the region since 2003.
Highlights
- WTI holds near $66 after a 5% weekly gain as Iran deadline raises disruption fears.
- U.S. crude inventories fell 9 million barrels, the biggest weekly draw since early September.
- Charts show bullish structure above $65, with $67 as the next breakout level.
Markets remain focused on the Strait of Hormuz, a chokepoint that handles a large share of global crude flows. Any restrictions on tanker traffic would immediately tighten export availability from the Gulf, amplifying price sensitivity even if physical supply has not yet been disrupted. That risk premium has built quickly this week, reflecting a shift from diplomatic optimism to a more urgent timeline.
Geopolitics and inventories tighten the tone
The rally has not been purely headline-driven. U.S. government data showing a 9 million barrel decline in crude inventories last week added fundamental support and helped prices hold their gains. The draw was the steepest since early September, reinforcing the view that near-term balances can tighten quickly when refinery demand improves or imports fluctuate.
Still, the market’s forward path remains tied to diplomacy. A negotiated step forward could drain the risk premium as quickly as it arrived, while any escalation would sharpen fears around shipping lanes and insurance costs for Gulf cargoes. Traders are also watching whether the current risk repricing becomes embedded into prompt spreads and freight markets, a sign that physical participants are adjusting as well.
Bullish chart structure keeps $67 in focus
On the 4-hour chart, WTI is pressing the upper boundary of a rising trend structure that has guided price action since early January. Price remains above the 20, 50, 100, and 200 period exponential moving averages, which are aligned in bullish order between roughly $62 and $65. The 20-period EMA near $65.2 is acting as first support, followed by the 50-period EMA around $64.3. The 200-period EMA near $62.3 sits close to the ascending trendline from the January lows, creating a deeper support band.
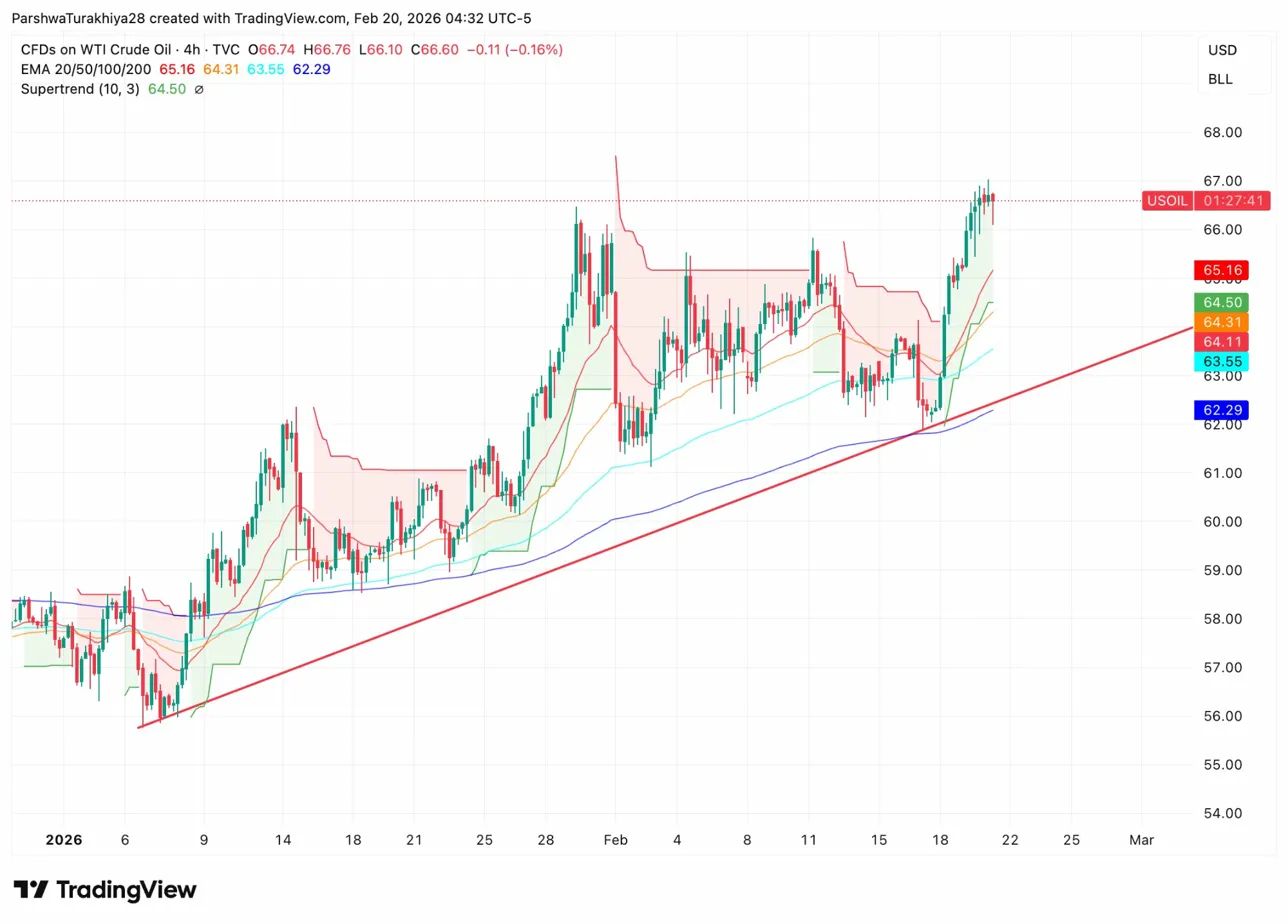
WTI price dynamics (Source: TradingView)
Momentum remains constructive, though some consolidation would be typical after the week’s sharp advance. The Supertrend indicator has flipped positive and is tracking below price near the mid-$64 area, reinforcing the near-term bullish bias as long as WTI holds above $65.
A sustained break above $67 would open room toward $68 to $70. On the downside, a close below $64 would signal fading momentum and expose the $62 to $63 zone, where the broader uptrend would be tested more directly.
As previously discussed, WTI has repeatedly swung between geopolitical spikes and oversupply narratives this year, with sharp pullbacks following failed breakouts above $65 to $66. This time, the catalyst is a tighter diplomatic clock, and the market’s next move will likely hinge on whether talks produce de-escalation or more confrontation.


Latest WTI News


-
 Afghanistan
-
 Albania
-
 Algeria
-
 Angola
-
 Argentina
-
 Armenia
-
 Australia
-
 Austria
-
 Azerbaijan
-
 Bahamas
-
 Bahrain
-
 Bangladesh
-
 Belarus
-
 Belgium
-
 Bolivia
-
 Botswana
-
 Brazil
-
 Brunei
-
 Bulgaria
-
 Cambodia
-
 Cameroon
-
 Canada
-
 Chile
Chile
-
 China
China
-
 Colombia
-
 Congo
Congo
-
 Costa Rica
-
 Cote d'Ivoire
-
 Croatia
-
 Cuba
Cuba
-
 Cyprus
-
 Czechia
-
 DR Congo
-
 Denmark
-
 Dominican Republic
-
 Ecuador
-
 Egypt
Egypt
-
 El Salvador
-
 Estonia
-
 Eswatini
-
 Ethiopia
-
 Finland
-
 France
-
 Georgia
-
 Germany
-
 Ghana
Ghana
-
 Greece
-
 Haiti
Haiti
-
 Hong Kong
-
 Hungary
-
 India
India
-
 Indonesia
-
 Iran, Islamic republic
-
 Iraq
Iraq
-
 Ireland
-
 Israel
-
 Italy
Italy
-
 Jamaica
-
 Japan
Japan
-
 Jordan
-
 Kazakhstan
-
 Kenya
Kenya
-
 Korea
Korea
-
 Kuwait
-
 Kyrgyzstan
-
 Laos
Laos
-
 Latvia
-
 Lebanon
-
 Lesotho
-
 Libya
Libya
-
 Lithuania
-
 Luxembourg
-
 Madagascar
-
 Malaysia
-
 Malta
Malta
-
 Mauritius
-
 Mexico
-
 Moldova
-
 Mongolia
-
 Montenegro
-
 Morocco
-
 Mozambique
-
 Myanmar
-
 Namibia
-
 Nepal
Nepal
-
 Netherlands
-
 New Zealand
-
 Nigeria
-
 North Macedonia
-
 Norway
-
 Oman
Oman
-
 Pakistan
-
 Palestine
-
 Panama
-
 Papua New Guinea
-
 Paraguay
-
 Peru
Peru
-
 Philippines
-
 Poland
-
 Portugal
-
 Puerto Rico
-
 Qatar
Qatar
-
 Reunion
-
 Romania
-
 Rwanda
-
 Saudi Arabia
-
 Serbia
-
 Singapore
-
 Slovakia
-
 Slovenia
-
 Somalia
-
 South Africa
-
 Spain
Spain
-
 Sri Lanka
-
 Sweden
-
 Switzerland
-
 Syria
Syria
-
 Taiwan
-
 Tajikistan
-
 Tanzania
-
 Thailand
-
 Trinidad and Tobago
-
 Tunisia
-
 Turkey
-
 UAE
UAE
-
 Uganda
-
 Ukraine
-
 United Kingdom
-
United States
-
 Uruguay
-
 Uzbekistan
-
 Venezuela
-
 Vietnam
-
 Yemen
Yemen
-
 Zambia
-
 Zimbabwe
- Forex
- Crypto
