
Gold AI price forecast: Rallies toward $5,378 as war tensions amplify breakout momentum

Gold is trading near $5,378 after a powerful rally from the $5,200 region, with the price pushing to fresh short-term highs as bullish momentum strengthens. The recent breakout above prior resistance has shifted the structure firmly in favor of buyers, with escalating geopolitical conflict adding a fresh layer of haven demand.
The immediate trend is clearly positive. Gold is trading above the 20, 50, and 100-period EMAs, all of which are sloping upward beneath the current price. The 200-period EMA near the $5,142 zone now acts as deeper structural support rather than resistance. Rising military tensions and cross-border escalation have increased defensive positioning across global markets, reinforcing the upward technical structure.
Gold is currently holding the $5,300 to $5,350 region as near-term support after breaking out from consolidation around $5,200. The steady formation of higher highs and higher lows reflects sustained demand, with capital rotating toward safe-haven assets amid uncertainty surrounding energy routes, commodity supply chains, and currency stability.
AI analysis suggests trend continuation with rising volatility. Near-term models favor consolidation between $5,300 and $5,420 unless a decisive extension above recent highs triggers another acceleration leg. War-driven risk repricing remains a key catalyst for volatility expansion.
Chart and technical overview
Gold remains comfortably above the 200-period EMA near $5,142, confirming the broader bullish shift. The 20-period EMA is positioned near $5,297, the 50-period EMA near $5,243, and the 100-period EMA around $5,200, creating layered support beneath the price.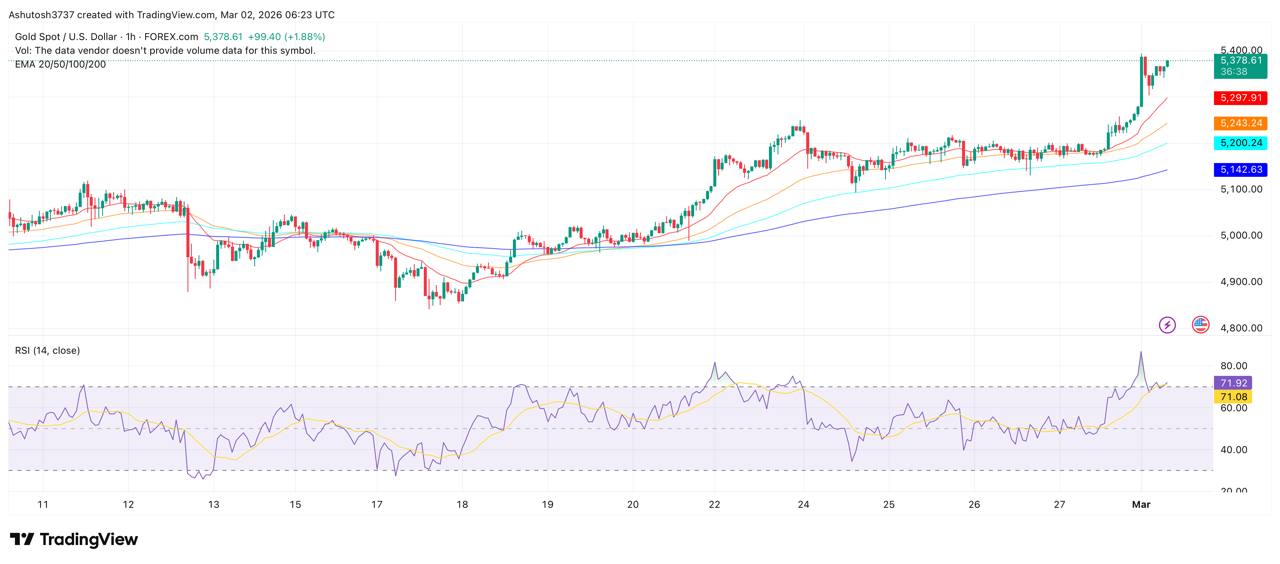
Gold price dynamics (Source: TradingView)
RSI is hovering in the low 70, indicating strong momentum with conditions nearing overbought territory. While this supports continuation potential, brief pauses or shallow pullbacks would not be unusual after the sharp advance.
Immediate support sits near $5,300, followed by $5,243 and then $5,200. Resistance is developing near $5,400. Market structure reflects breakout continuation rather than range compression.
Technical summary
- Trend: Bullish above all major EMAs.
- Momentum reading: Strong with RSI in the low 70s.
- Market structure: Breakout continuation with higher highs forming.
- Support and resistance: Support at $5,300 and $5,200. Resistance near $5,400.
- Risk trigger: A sustained move above $5,400 would reinforce upside momentum. A break below $5,200 would weaken the bullish bias.
- Technical bias: Uptrend with continuation probability near 65 percent.
Fundamental pulse
Gold is reacting not only to shifts in real yields and currency dynamics, but also to intensifying geopolitical conflict. Ongoing war developments have increased volatility across equities and energy markets, pushing institutional flows toward traditional defensive assets. Heightened uncertainty around trade corridors, sanctions, and supply disruptions has reinforced gold’s appeal as a capital preservation vehicle.At the same time, central bank reserve diversification trends remain supportive in periods of geopolitical fragmentation. If conflict risks broaden or persist, haven allocation could remain elevated. Conversely, any rapid diplomatic resolution could reduce some immediate risk premium embedded in current prices.
Summary section
Gold is pressing toward $5,378 with a firmly constructive pattern, strengthened by rising geopolitical tension. As long as the price remains above the $5,200 to $5,250 support band, pullbacks are likely to attract buyers rather than signal a reversal.What’s next
- Upside trigger: A sustained move above $5,400 would open the path toward the mid $5,400s and beyond.
- Downside risk: A decisive drop below $5,200 would suggest a deeper retracement toward the $5,140 zone.


Latest Gold News


-
 Afghanistan
-
 Albania
-
 Algeria
-
 Angola
-
 Argentina
-
 Armenia
-
 Australia
-
 Austria
-
 Azerbaijan
-
 Bahamas
-
 Bahrain
-
 Bangladesh
-
 Belarus
-
 Belgium
-
 Bolivia
-
 Botswana
-
 Brazil
-
 Brunei
-
 Bulgaria
-
 Cambodia
-
 Cameroon
-
 Canada
-
 Chile
Chile
-
 China
China
-
 Colombia
-
 Congo
Congo
-
 Costa Rica
-
 Cote d'Ivoire
-
 Croatia
-
 Cuba
Cuba
-
 Cyprus
-
 Czechia
-
 DR Congo
-
 Denmark
-
 Dominican Republic
-
 Ecuador
-
 Egypt
Egypt
-
 El Salvador
-
 Estonia
-
 Eswatini
-
 Ethiopia
-
 Finland
-
 France
-
 Georgia
-
 Germany
-
 Ghana
Ghana
-
 Greece
-
 Haiti
Haiti
-
 Hong Kong
-
 Hungary
-
 India
India
-
 Indonesia
-
 Iran, Islamic republic
-
 Iraq
Iraq
-
 Ireland
-
 Israel
-
 Italy
Italy
-
 Jamaica
-
 Japan
Japan
-
 Jordan
-
 Kazakhstan
-
 Kenya
Kenya
-
 Korea
Korea
-
 Kuwait
-
 Kyrgyzstan
-
 Laos
Laos
-
 Latvia
-
 Lebanon
-
 Lesotho
-
 Libya
Libya
-
 Lithuania
-
 Luxembourg
-
 Madagascar
-
 Malaysia
-
 Malta
Malta
-
 Mauritius
-
 Mexico
-
 Moldova
-
 Mongolia
-
 Montenegro
-
 Morocco
-
 Mozambique
-
 Myanmar
-
 Namibia
-
 Nepal
Nepal
-
 Netherlands
-
 New Zealand
-
 Nigeria
-
 North Macedonia
-
 Norway
-
 Oman
Oman
-
 Pakistan
-
 Palestine
-
 Panama
-
 Papua New Guinea
-
 Paraguay
-
 Peru
Peru
-
 Philippines
-
 Poland
-
 Portugal
-
 Puerto Rico
-
 Qatar
Qatar
-
 Reunion
-
 Romania
-
 Rwanda
-
 Saudi Arabia
-
 Serbia
-
 Singapore
-
 Slovakia
-
 Slovenia
-
 Somalia
-
 South Africa
-
 Spain
Spain
-
 Sri Lanka
-
 Sweden
-
 Switzerland
-
 Syria
Syria
-
 Taiwan
-
 Tajikistan
-
 Tanzania
-
 Thailand
-
 Trinidad and Tobago
-
 Tunisia
-
 Turkey
-
 UAE
UAE
-
 Uganda
-
 Ukraine
-
 United Kingdom
-
United States
-
 Uruguay
-
 Uzbekistan
-
 Venezuela
-
 Vietnam
-
 Yemen
Yemen
-
 Zambia
-
 Zimbabwe
- Forex
- Crypto
