
Interactive Brokers stock gains 5.26% as shares leap to new highs on strong buying

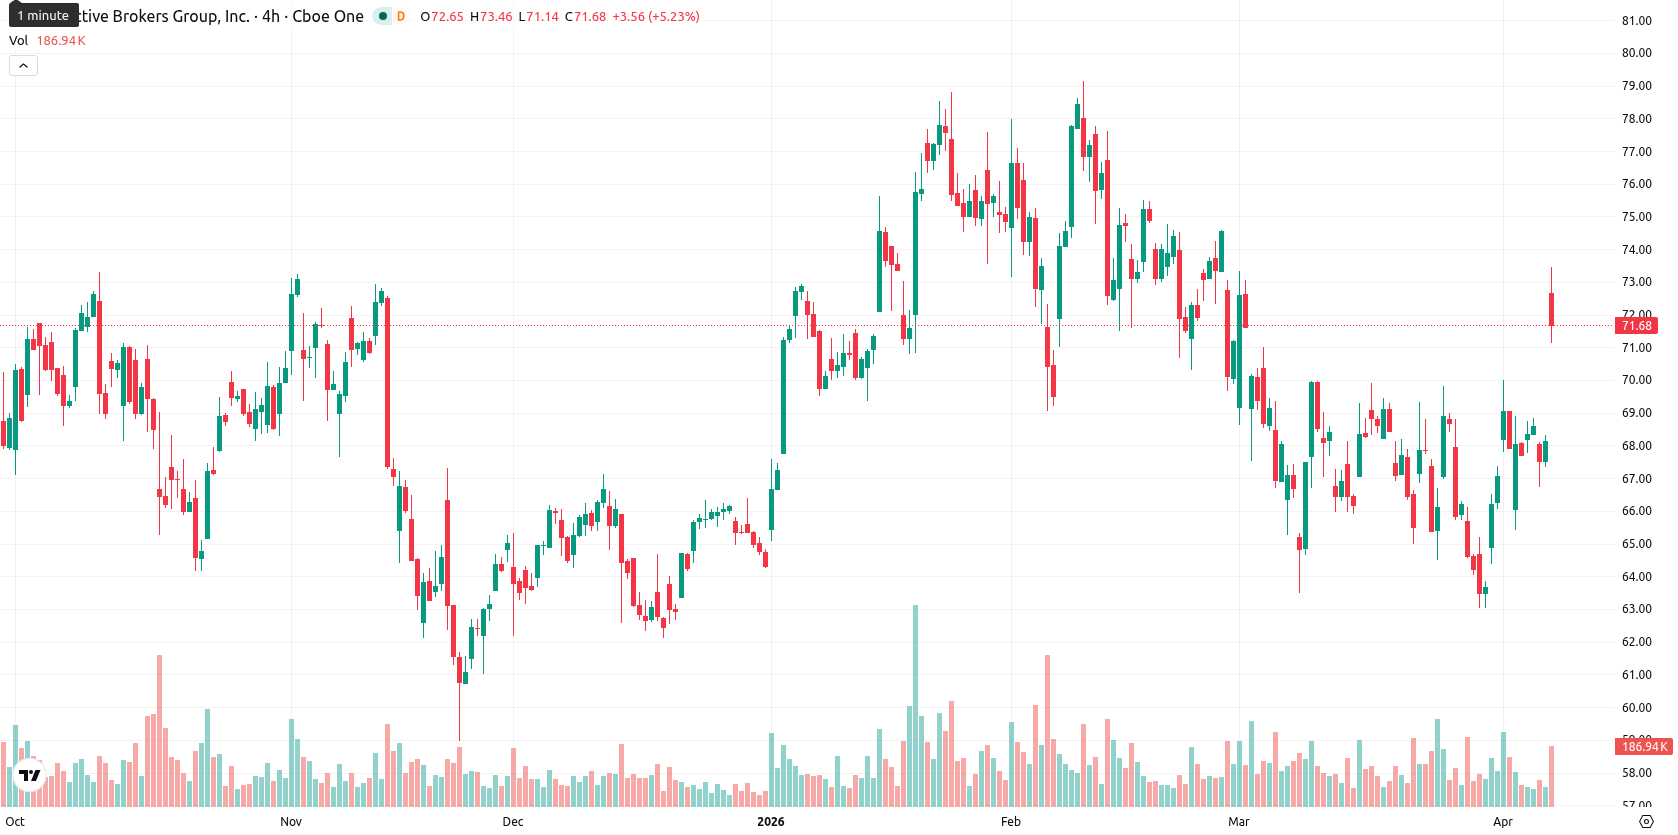
Interactive Brokers Group, Inc. (IBKR) is trading at $71.70 after a 5.26% gain on the day, currently positioned above both the MA-20 at $67.24 and MA-200 at $66.53, but just below the MA-50 at $70.82. This puts the stock in a strong position with bullish short-term and long-term momentum while encountering some resistance from the medium-term moving average.
Highlights
- IBKR shows sustained short-term and long-term bullish momentum, trading above key moving averages with price near session highs.
- Momentum indicators are mixed, with buyer dominance and overbought oscillators suggesting aggressive but potentially overextended buying.
- Price is expected to consolidate between $69.00 and $73.00, with an over 80% probability of further gains unless support below $69.00 breaks.
Mixed momentum as overbought signals clash with weak trend
Momentum signals on the daily chart are mixed: MACD shows strong selling bias, while ADX remains weak at 13.36, indicating limited directional strength. Oscillators diverge — RSI points to selling (49.77), Stoch RSI and BBP both signal overbought buyer excess, and CCI remains neutral. BBP at 0.80 confirms intraday buyer dominance. After a strong gap-up at the open ($68.11 to $72.65), IBKR has advanced 5.26% on the day and currently trades near the upper end of today’s range ($71.18–$73.46), reflecting high volatility and sustained strength toward session highs. The balance of indicators points to aggressive but potentially overextended buyer activity, and traders should note the divergence between overbought oscillators and mixed momentum cues.
Upside favored as narrow range contains volatility risk
For the next five trading days, the expected normalized range is approximately $69.00 to $73.00, keeping price swings within a typical volatility band relative to current levels. The probability of further price gains is more likely, with a very high probability (more than 80%) compared to downside risk. The baseline scenario anticipates the price consolidating between $69.00 and $73.00. If bulls overcome resistance, a bullish scenario could see a sustained break above $73.00, while a bearish case would only materialize if the price falls decisively below immediate support near $69.00.
Earlier, analysts noted that Interactive Brokers was exhibiting bullish momentum despite mixed technical signals and faced key resistance levels. The latest surge strengthens this view, but traders should closely watch for a sustained breakout above $73.00 as confirmation of continued upside.


Latest Interactive Brokers News


-
 Afghanistan
-
 Albania
-
 Algeria
-
 Angola
-
 Argentina
-
 Armenia
-
 Australia
-
 Austria
-
 Azerbaijan
-
 Bahamas
-
 Bahrain
-
 Bangladesh
-
 Belarus
-
 Belgium
-
 Bolivia
-
 Botswana
-
 Brazil
-
 Brunei
-
 Bulgaria
-
 Cambodia
-
 Cameroon
-
 Canada
-
 Chile
Chile
-
 China
China
-
 Colombia
-
 Congo
Congo
-
 Costa Rica
-
 Cote d'Ivoire
-
 Croatia
-
 Cuba
Cuba
-
 Cyprus
-
 Czechia
-
 DR Congo
-
 Denmark
-
 Dominican Republic
-
 Ecuador
-
 Egypt
Egypt
-
 El Salvador
-
 Estonia
-
 Eswatini
-
 Ethiopia
-
 Finland
-
 France
-
 Georgia
-
 Germany
-
 Ghana
Ghana
-
 Greece
-
 Haiti
Haiti
-
 Hong Kong
-
 Hungary
-
 India
India
-
 Indonesia
-
 Iran, Islamic republic
-
 Iraq
Iraq
-
 Ireland
-
 Israel
-
 Italy
Italy
-
 Jamaica
-
 Japan
Japan
-
 Jordan
-
 Kazakhstan
-
 Kenya
Kenya
-
 Korea
Korea
-
 Kuwait
-
 Kyrgyzstan
-
 Laos
Laos
-
 Latvia
-
 Lebanon
-
 Lesotho
-
 Libya
Libya
-
 Lithuania
-
 Luxembourg
-
 Madagascar
-
 Malaysia
-
 Malta
Malta
-
 Mauritius
-
 Mexico
-
 Moldova
-
 Mongolia
-
 Montenegro
-
 Morocco
-
 Mozambique
-
 Myanmar
-
 Namibia
-
 Nepal
Nepal
-
 Netherlands
-
 New Zealand
-
 Nigeria
-
 North Macedonia
-
 Norway
-
 Oman
Oman
-
 Pakistan
-
 Palestine
-
 Panama
-
 Papua New Guinea
-
 Paraguay
-
 Peru
Peru
-
 Philippines
-
 Poland
-
 Portugal
-
 Puerto Rico
-
 Qatar
Qatar
-
 Reunion
-
 Romania
-
 Rwanda
-
 Saudi Arabia
-
 Serbia
-
 Singapore
-
 Slovakia
-
 Slovenia
-
 Somalia
-
 South Africa
-
 Spain
Spain
-
 Sri Lanka
-
 Sweden
-
 Switzerland
-
 Syria
Syria
-
 Taiwan
-
 Tajikistan
-
 Tanzania
-
 Thailand
-
 Trinidad and Tobago
-
 Tunisia
-
 Turkey
-
 UAE
UAE
-
 Uganda
-
 Ukraine
-
 United Kingdom
-
United States
-
 Uruguay
-
 Uzbekistan
-
 Venezuela
-
 Vietnam
-
 Yemen
Yemen
-
 Zambia
-
 Zimbabwe
- Forex
- Crypto
