
Interactive Brokers stock rises around 3.5% as quarterly EPS growth hits 27.7%

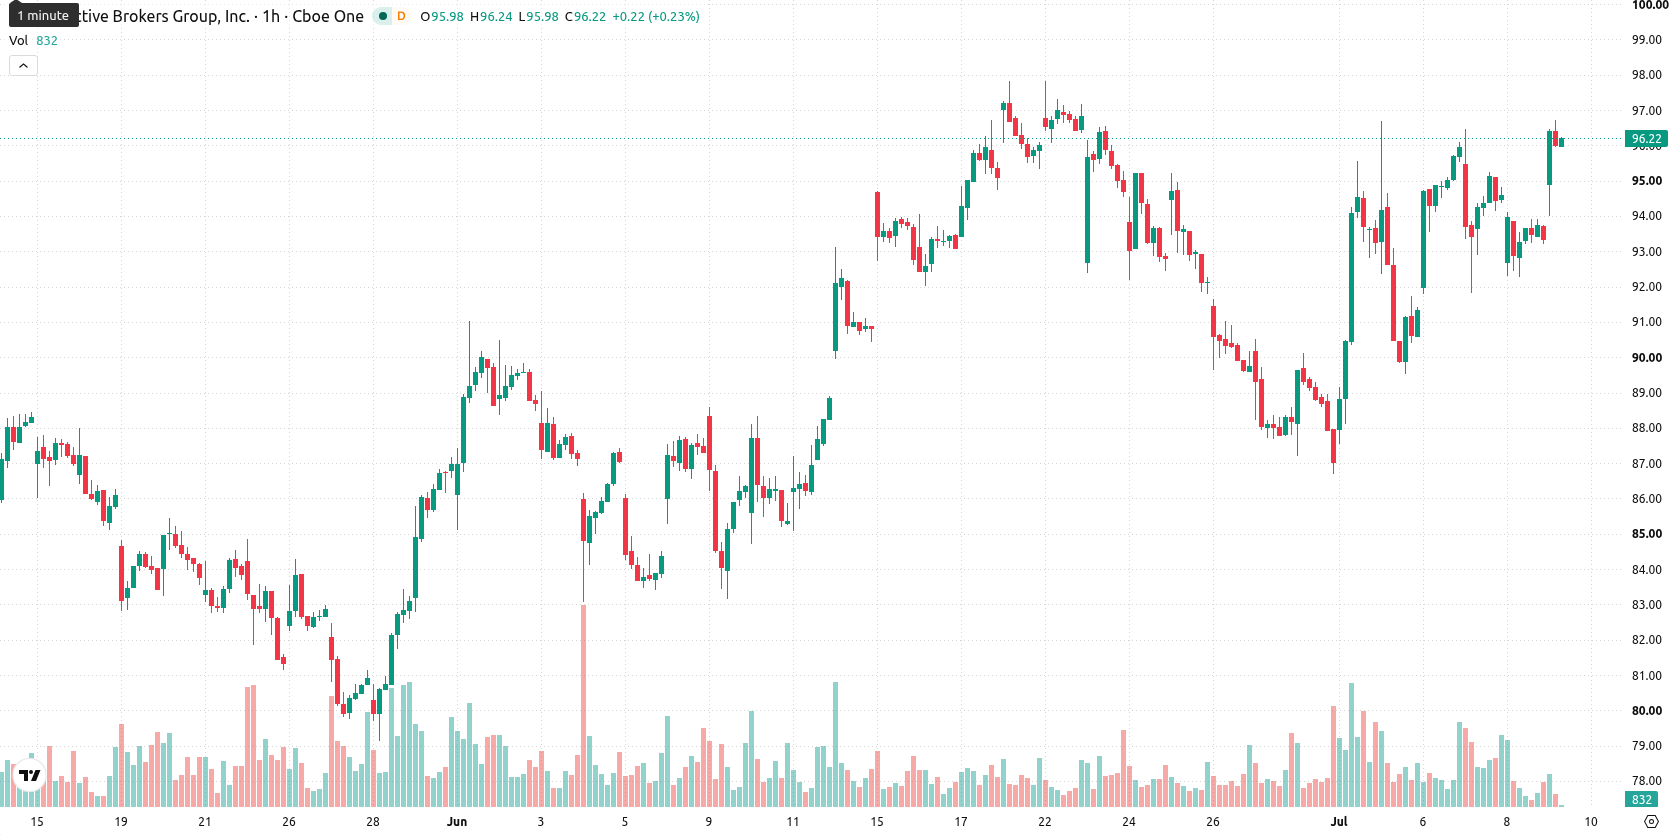
Interactive Brokers Group, Inc. (IBKR) stock is trading at $96.59, up 3.42% for the day with the move keeping the shares positioned above their key moving averages.
 97.40
96.72
97.40
96.72
Highlights
- Interactive Brokers reported 27.7% year-over-year EPS growth in the latest quarter, underscoring strong operational profitability.
- The firm maintains a debt-free balance sheet and has expanded to 5 million global accounts, supporting long-term scalability and reduced risk.
- IBKR/USD exhibits bullish momentum with strong technical support at $92.99 and is forecast to trade between $94.44 and $99.12, though short-term overbought signals suggest potential for a pullback or consolidation.
Earnings growth and zero debt draw global momentum investors
Interactive Brokers has reported 25.6% earnings per share growth over the past year, reflecting strong operational expansion and fueling buying interest in IBKR shares. This robust financial performance is reinforced by 27.7% year-over-year EPS growth in its latest quarter, further validating the company's profitability trajectory. According to Fool, the firm has also expanded globally to 5 million accounts while keeping a zero-debt balance sheet, which reduces financial risk and supports confidence in future scalability. The stock's compliance with the Mark Minervini Trend Template and High Growth Momentum screen continues to attract momentum-focused strategies.
Overbought oscillators temper upside momentum above major supports
On the technical front, IBKR is trading above the MA-20 and MA-50 on the hourly timeframe and remains well above the MA-200 on the daily chart. The Ichimoku Kijun sits at $92.99 and now acts as key immediate support. Among indicators, the Moving Average Convergence Divergence (MACD) issues a buy signal, the Average Directional Index (ADX) remains neutral, and the Relative Strength Index (RSI) registers at 62.21, also supporting a buy stance. However, both the Stochastic RSI and Commodity Channel Index (CCI) are in overbought territory, and Bull/Bear Power indicates strong buyer dominance for today’s session. The Awesome Oscillator also supports current upside momentum, but the combination of sustained strength with overbought readings among oscillators highlights divergence and signals risk of a short-term pause or pullback.
Range-bound outlook prevails as breakout odds favor further upside
Looking ahead, IBKR is expected to trade within a typical volatility band of $94.44 to $99.12 over the next several days. There is a 74% probability for an upward breakout amid ongoing strength, while the probability of a downward move is lower at 26%. The base case is for price to consolidate within this defined range; a rally through resistance could initiate a further upward leg, whereas a sustained break below support at $94.44 would signal a potential near-term pullback.
Earlier, analysts noted that Interactive Brokers' stock was demonstrating bullish momentum supported by technical strength and robust market sentiment. The current combination of strong earnings growth and global account expansion adds fundamental backing to this view, making a potential upward breakout above $99.12 the key risk and opportunity for traders to watch in the near term.



Latest Interactive Brokers News






-
 Afghanistan
-
 Albania
-
 Algeria
-
 Angola
-
 Argentina
-
 Armenia
-
 Australia
-
 Austria
-
 Azerbaijan
-
 Bahamas
-
 Bahrain
-
 Bangladesh
-
 Belarus
-
 Belgium
-
 Bolivia
-
 Botswana
-
 Brazil
-
 Brunei
-
 Bulgaria
-
 Cambodia
-
 Cameroon
-
 Canada
-
 Chile
Chile
-
 China
China
-
 Colombia
-
 Congo
Congo
-
 Costa Rica
-
 Cote d'Ivoire
-
 Croatia
-
 Cuba
Cuba
-
 Cyprus
-
 Czechia
-
 DR Congo
-
 Denmark
-
 Dominican Republic
-
 Ecuador
-
 Egypt
Egypt
-
 El Salvador
-
 Estonia
-
 Eswatini
-
 Ethiopia
-
 Finland
-
 France
-
 Georgia
-
 Germany
-
 Ghana
Ghana
-
 Greece
-
 Haiti
Haiti
-
 Hong Kong
-
 Hungary
-
 India
India
-
 Indonesia
-
 Iran, Islamic republic
-
 Iraq
Iraq
-
 Ireland
-
 Israel
-
 Italy
Italy
-
 Jamaica
-
 Japan
Japan
-
 Jordan
-
 Kazakhstan
-
 Kenya
Kenya
-
 Korea
Korea
-
 Kuwait
-
 Kyrgyzstan
-
 Laos
Laos
-
 Latvia
-
 Lebanon
-
 Lesotho
-
 Libya
Libya
-
 Lithuania
-
 Luxembourg
-
 Madagascar
-
 Malaysia
-
 Malta
Malta
-
 Mauritius
-
 Mexico
-
 Moldova
-
 Mongolia
-
 Montenegro
-
 Morocco
-
 Mozambique
-
 Myanmar
-
 Namibia
-
 Nepal
Nepal
-
 Netherlands
-
 New Zealand
-
 Nigeria
-
 North Macedonia
-
 Norway
-
 Oman
Oman
-
 Pakistan
-
 Palestine
-
 Panama
-
 Papua New Guinea
-
 Paraguay
-
 Peru
Peru
-
 Philippines
-
 Poland
-
 Portugal
-
 Puerto Rico
-
 Qatar
Qatar
-
 Reunion
-
 Romania
-
 Rwanda
-
 Saudi Arabia
-
 Serbia
-
 Singapore
-
 Slovakia
-
 Slovenia
-
 Somalia
-
 South Africa
-
 Spain
Spain
-
 Sri Lanka
-
 Sweden
-
 Switzerland
-
 Syria
Syria
-
 Taiwan
-
 Tajikistan
-
 Tanzania
-
 Thailand
-
 Trinidad and Tobago
-
 Tunisia
-
 Turkey
-
 UAE
UAE
-
 Uganda
-
 Ukraine
-
 United Kingdom
-
United States
-
 Uruguay
-
 Uzbekistan
-
 Venezuela
-
 Vietnam
-
 Yemen
Yemen
-
 Zambia
-
 Zimbabwe
- Forex
- Crypto











