
Marathon Digital stock drops 3.23% as price stays above key averages

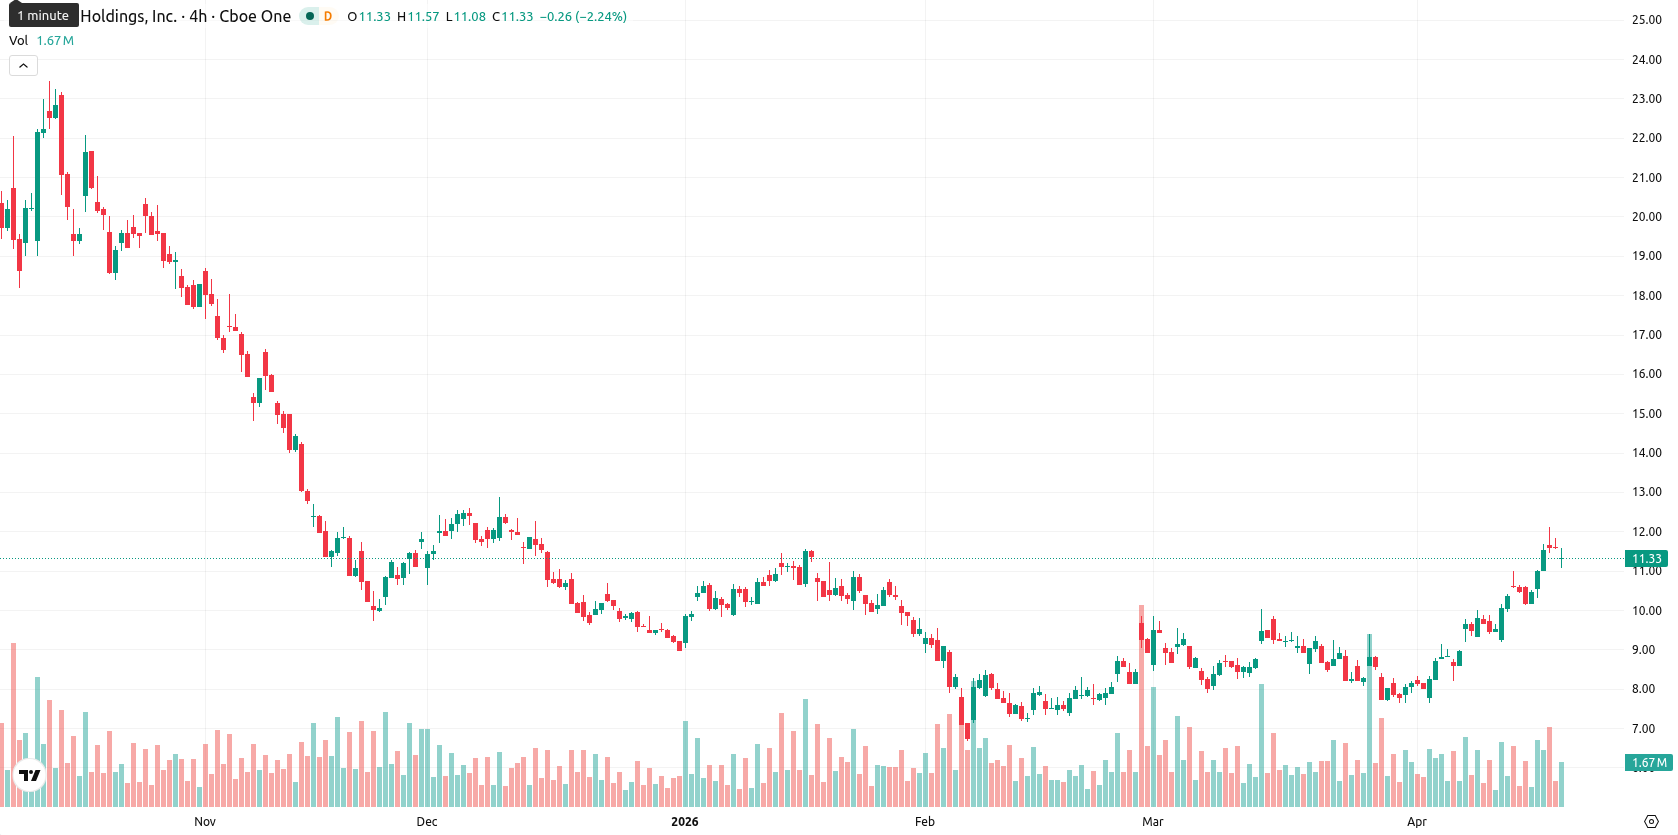
Marathon Digital Holdings, Inc. (MARA) is trading at $11.23 after a daily decline of 3.23%. The price remains above its key short- and medium-term moving averages, while sitting below longer-term trend levels.
Highlights
- MARA trades above short- and medium-term moving averages, signaling a bullish structure despite facing longer-term resistance.
- Momentum remains positive, but several overbought signals and a post-open downturn indicate rising risk of a short-term pullback.
- Expected five-session trading range is $10.50–$12.40, with downside more probable unless price breaks above $12.40 resistance.
Overbought signals intensify as upward momentum meets resistance
On the technical front, MARA closed above the SMA-20 at $9.21 and SMA-50 at $8.70, but stays beneath the SMA-200 resistance at $13.39. The Ichimoku Kijun level on the daily chart is at $9.87, offering nearby support. The MACD gives a Buy signal, with the ADX reflecting a neutral trend. Oscillators including RSI (73.13), Stoch RSI (maximum), and CCI (deep in overbought) indicate overbought conditions, while Bull/Bear Power (BBP) shows strong buyer dominance and the Awesome Oscillator affirms upward momentum. The session saw moderate volatility and a move toward the daily low, highlighting possible emerging divergence.
Sideways price risk remains amid weak upside conviction
In the short term, MARA is expected to fluctuate within the $10.50 — $12.40 range, reflecting typical volatility around current levels. The probability of an upside move remains below 20% with limited supportive indicators on the weekly timeframe; sideways price action is the baseline scenario. Any break above $12.40 would open the path toward longer-term resistance, while a bearish swing under $10.50 could trigger a deeper pullback to the next support.
Earlier, analysts noted that while Marathon Digital was exhibiting strong momentum, persistent overbought technical signals suggested the potential for a period of consolidation or correction. The current setup, with sustained overbought conditions and a narrowing trading band, reinforces a cautious stance and puts added emphasis on $10.50 as the next key support level to monitor for downside risk.


-
 Afghanistan
-
 Albania
-
 Algeria
-
 Angola
-
 Argentina
-
 Armenia
-
 Australia
-
 Austria
-
 Azerbaijan
-
 Bahamas
-
 Bahrain
-
 Bangladesh
-
 Belarus
-
 Belgium
-
 Bolivia
-
 Botswana
-
 Brazil
-
 Brunei
-
 Bulgaria
-
 Cambodia
-
 Cameroon
-
 Canada
-
 Chile
Chile
-
 China
China
-
 Colombia
-
 Congo
Congo
-
 Costa Rica
-
 Cote d'Ivoire
-
 Croatia
-
 Cuba
Cuba
-
 Cyprus
-
 Czechia
-
 DR Congo
-
 Denmark
-
 Dominican Republic
-
 Ecuador
-
 Egypt
Egypt
-
 El Salvador
-
 Estonia
-
 Eswatini
-
 Ethiopia
-
 Finland
-
 France
-
 Georgia
-
 Germany
-
 Ghana
Ghana
-
 Greece
-
 Haiti
Haiti
-
 Hong Kong
-
 Hungary
-
 India
India
-
 Indonesia
-
 Iran, Islamic republic
-
 Iraq
Iraq
-
 Ireland
-
 Israel
-
 Italy
Italy
-
 Jamaica
-
 Japan
Japan
-
 Jordan
-
 Kazakhstan
-
 Kenya
Kenya
-
 Korea
Korea
-
 Kuwait
-
 Kyrgyzstan
-
 Laos
Laos
-
 Latvia
-
 Lebanon
-
 Lesotho
-
 Libya
Libya
-
 Lithuania
-
 Luxembourg
-
 Madagascar
-
 Malaysia
-
 Malta
Malta
-
 Mauritius
-
 Mexico
-
 Moldova
-
 Mongolia
-
 Montenegro
-
 Morocco
-
 Mozambique
-
 Myanmar
-
 Namibia
-
 Nepal
Nepal
-
 Netherlands
-
 New Zealand
-
 Nigeria
-
 North Macedonia
-
 Norway
-
 Oman
Oman
-
 Pakistan
-
 Palestine
-
 Panama
-
 Papua New Guinea
-
 Paraguay
-
 Peru
Peru
-
 Philippines
-
 Poland
-
 Portugal
-
 Puerto Rico
-
 Qatar
Qatar
-
 Reunion
-
 Romania
-
 Rwanda
-
 Saudi Arabia
-
 Serbia
-
 Singapore
-
 Slovakia
-
 Slovenia
-
 Somalia
-
 South Africa
-
 Spain
Spain
-
 Sri Lanka
-
 Sweden
-
 Switzerland
-
 Syria
Syria
-
 Taiwan
-
 Tajikistan
-
 Tanzania
-
 Thailand
-
 Trinidad and Tobago
-
 Tunisia
-
 Turkey
-
 UAE
UAE
-
 Uganda
-
 Ukraine
-
 United Kingdom
-
United States
-
 Uruguay
-
 Uzbekistan
-
 Venezuela
-
 Vietnam
-
 Yemen
Yemen
-
 Zambia
-
 Zimbabwe
- Forex
- Crypto
