
NVDA shares remain in recent range as key oscillators highlight overbought conditions: weekly report

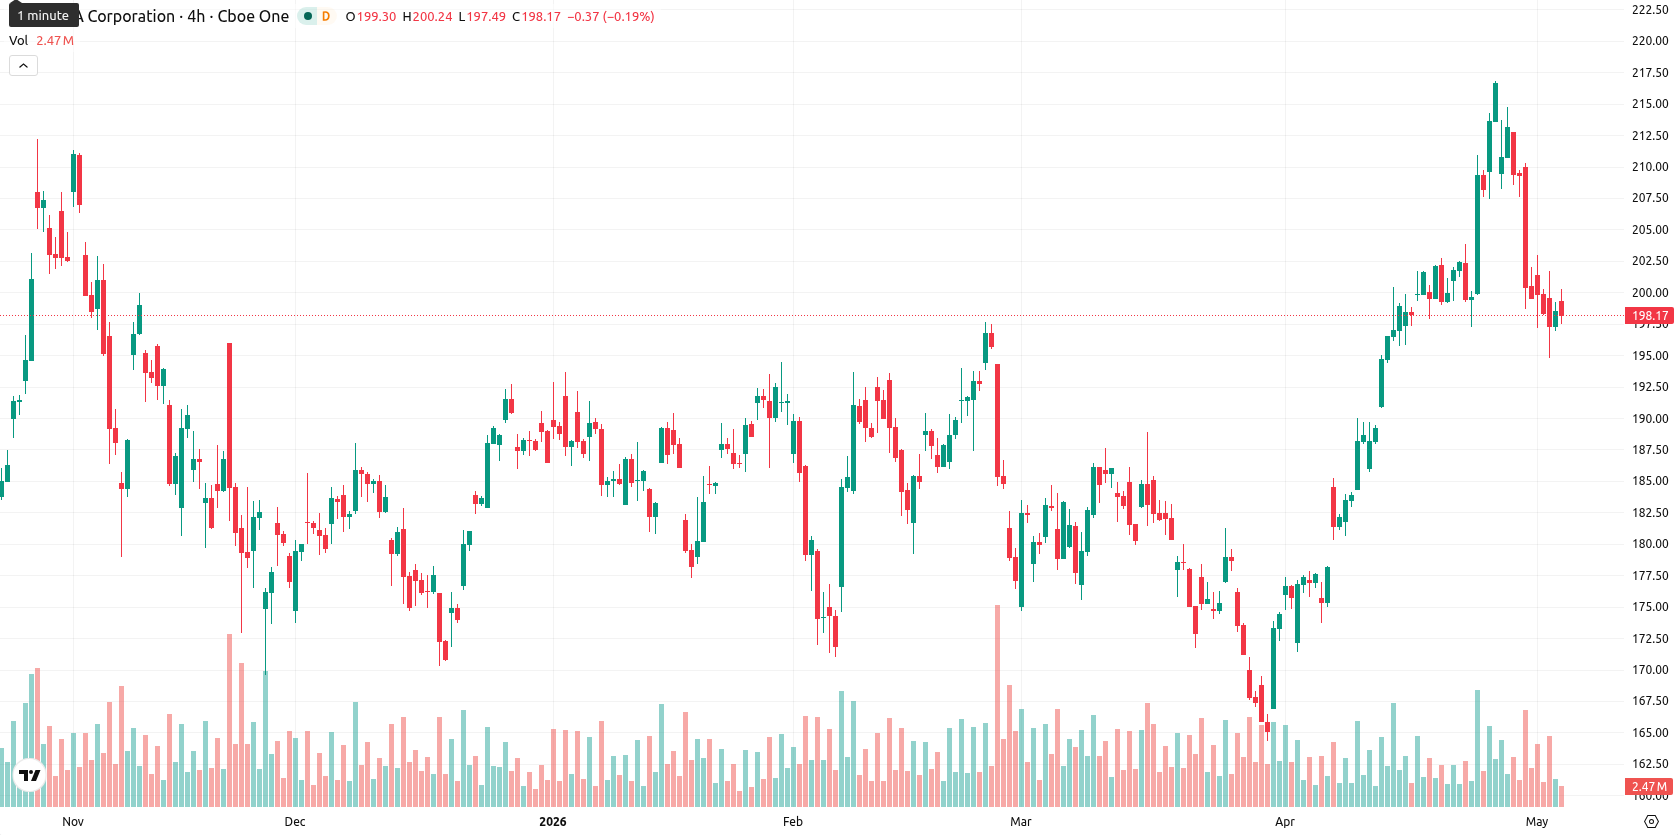
Nvidia Corporation (NVDA) is trading at $198.78, which places it well above key weekly moving averages: MA-20 at $186.76, MA-50 at $178.57, and MA-200 at $97.07. Over the last week, the price slipped by $0.35, down 0.41%, and now sits in the lower section of its recent weekly range, maintaining a strong bullish structure above dynamic support levels.
Highlights
- Nvidia is consolidating above dynamic support, maintaining a strong medium- and long-term bullish technical structure.
- Momentum indicators are mixed, with bullish signals offset by signs of overbought conditions and weak trend strength.
- Nvidia is projected to trade between $191.00 and $206.50 over the next week, with breakout risk on either side.
Institutional demand and China headwinds drive weekly sentiment shifts
Nvidia continues to experience strong institutional demand while maintaining a leading position in AI hardware. The company reported that, as of April 2026, its market capitalization has surpassed $5 trillion. Nvidia faces significant regulatory headwinds in China due to export controls, resulting in a complete loss of market share and a lack of revenue from H200 AI GPUs there. CEO Jensen Huang also reiterated support for regulatory institutions and the strategic use of Nvidia's AI products in the US public sector.
Mixed technical signals as overbought oscillators meet ongoing buying momentum
Technically, Nvidia remains above all major weekly moving averages, with the MA-20 at $186.76 acting as the nearest support level. The weekly MACD signals continued buying momentum, while the ADX shows a neutral trend, and several oscillators, including the Commodity Channel Index and Bull/Bear Power, highlight overbought conditions. RSI is bullish and the Stochastic RSI is neutral, leading to mixed signals, while the Awesome Oscillator confirms upside momentum. Key support is at $191.00, with resistance at $206.50, and volatility for the week measured at 9.17%.
Sideways outlook expected as consolidation persists between key levels next week
For the next five trading days, Nvidia is likely to remain in a consolidation phase within the $191.00 to $206.50 range. Technicals reflect a balanced probability of upward or downward movement, as half of the key indicators point to buy signals while oscillators signal caution in overbought territory. A bullish break above $206.50 could signal renewed momentum, while a drop below $191.00 would open the way for deeper pullbacks. The baseline scenario favors sideways price action between established support and resistance.
Earlier, analysts noted that Nvidia was navigating persistent regulatory challenges in China while benefiting from strong institutional support and a positive long-term market outlook. The current analysis reinforces this perspective, as ongoing overbought signals and robust weekly technical structure suggest that traders should closely watch for a decisive move outside the $191.00 to $206.50 consolidation range in the coming sessions.


-
 Afghanistan
-
 Albania
-
 Algeria
-
 Angola
-
 Argentina
-
 Armenia
-
 Australia
-
 Austria
-
 Azerbaijan
-
 Bahamas
-
 Bahrain
-
 Bangladesh
-
 Belarus
-
 Belgium
-
 Bolivia
-
 Botswana
-
 Brazil
-
 Brunei
-
 Bulgaria
-
 Cambodia
-
 Cameroon
-
 Canada
-
 Chile
Chile
-
 China
China
-
 Colombia
-
 Congo
Congo
-
 Costa Rica
-
 Cote d'Ivoire
-
 Croatia
-
 Cuba
Cuba
-
 Cyprus
-
 Czechia
-
 DR Congo
-
 Denmark
-
 Dominican Republic
-
 Ecuador
-
 Egypt
Egypt
-
 El Salvador
-
 Estonia
-
 Eswatini
-
 Ethiopia
-
 Finland
-
 France
-
 Georgia
-
 Germany
-
 Ghana
Ghana
-
 Greece
-
 Haiti
Haiti
-
 Hong Kong
-
 Hungary
-
 India
India
-
 Indonesia
-
 Iran, Islamic republic
-
 Iraq
Iraq
-
 Ireland
-
 Israel
-
 Italy
Italy
-
 Jamaica
-
 Japan
Japan
-
 Jordan
-
 Kazakhstan
-
 Kenya
Kenya
-
 Korea
Korea
-
 Kuwait
-
 Kyrgyzstan
-
 Laos
Laos
-
 Latvia
-
 Lebanon
-
 Lesotho
-
 Libya
Libya
-
 Lithuania
-
 Luxembourg
-
 Madagascar
-
 Malaysia
-
 Malta
Malta
-
 Mauritius
-
 Mexico
-
 Moldova
-
 Mongolia
-
 Montenegro
-
 Morocco
-
 Mozambique
-
 Myanmar
-
 Namibia
-
 Nepal
Nepal
-
 Netherlands
-
 New Zealand
-
 Nigeria
-
 North Macedonia
-
 Norway
-
 Oman
Oman
-
 Pakistan
-
 Palestine
-
 Panama
-
 Papua New Guinea
-
 Paraguay
-
 Peru
Peru
-
 Philippines
-
 Poland
-
 Portugal
-
 Puerto Rico
-
 Qatar
Qatar
-
 Reunion
-
 Romania
-
 Rwanda
-
 Saudi Arabia
-
 Serbia
-
 Singapore
-
 Slovakia
-
 Slovenia
-
 Somalia
-
 South Africa
-
 Spain
Spain
-
 Sri Lanka
-
 Sweden
-
 Switzerland
-
 Syria
Syria
-
 Taiwan
-
 Tajikistan
-
 Tanzania
-
 Thailand
-
 Trinidad and Tobago
-
 Tunisia
-
 Turkey
-
 UAE
UAE
-
 Uganda
-
 Ukraine
-
 United Kingdom
-
United States
-
 Uruguay
-
 Uzbekistan
-
 Venezuela
-
 Vietnam
-
 Yemen
Yemen
-
 Zambia
-
 Zimbabwe
- Forex
- Crypto
