
Qualcomm stock price forecast: $196.00 resistance as QCOM advances 3.46%

Qualcomm Incorporated (QCOM) is trading at $194.15, up 3.46% on the day and sitting well above its key moving averages, reflecting strong price momentum.
 183.94
190.99
183.94
190.99
Highlights
- Qualcomm’s Q2 net profit surged 162% year-over-year, driven by record automotive chip revenue and expanding demand from institutional investors.
- Corporate actions including a $20 billion stock repurchase authorization, higher quarterly dividend, and a 90-day US-China tariff pause are fueling positive investor sentiment.
- QCOM trades in a strong bullish trend with momentum indicators overbought, targeting a $188.00–$198.00 range and high probability of further gains.
Earnings surge and capital returns drive renewed buying interest
Qualcomm’s surge is propelled by its latest Q2 earnings release, which showed a 162% year-over-year jump in net profit and a record high in automotive chip revenue, highlighting significant operational expansion and attracting new institutional demand. The announcement of a 90-day pause on US-China tariffs has further lifted sentiment by easing supply chain concerns and clarifying revenue streams tied to China, translating into renewed buying interest. Additionally, the Board’s approval of a $20 billion increase in stock repurchases and a raised quarterly dividend enhances capital returns, offering direct support for share value.
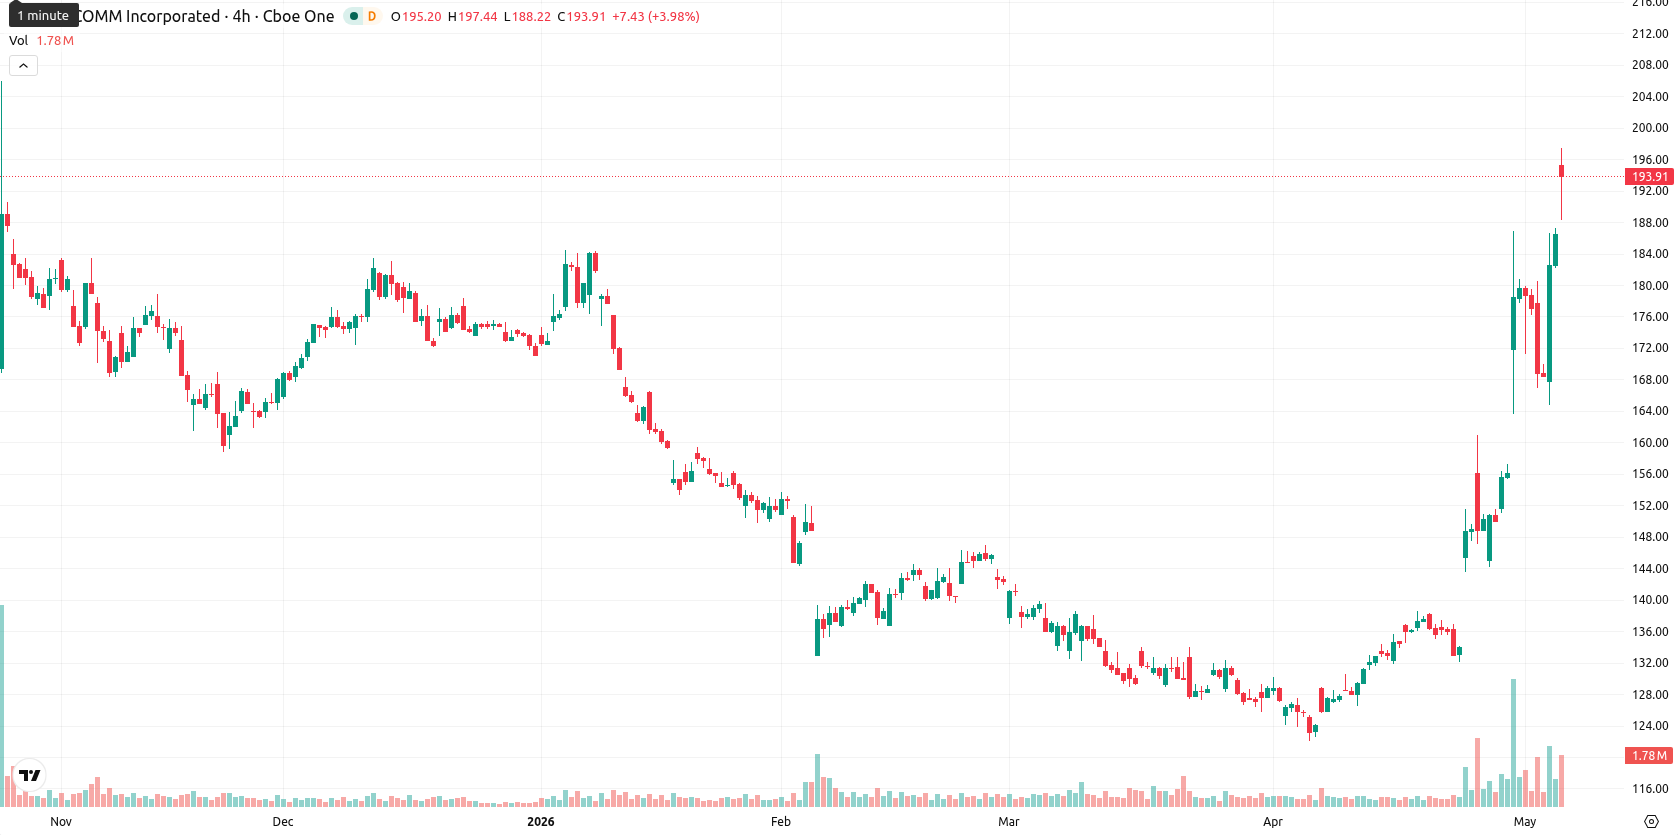
Technical breakout confirmed as oscillators warn of possible exhaustion
QCOM has decisively cleared multiple technical thresholds, trading above the MA-20 at $145.64, MA-50 at $138.17, and MA-200 at $156.97, with the Ichimoku Kijun level positioned at $155.43 and now acting as immediate support. On the daily chart, the MACD and ADX confirm sustained buy signals and strong upward momentum, while the Awesome Oscillator supports ongoing bullishness. Oscillator readings show that RSI, Stoch RSI, and CCI have entered overbought territory, which can signal short-term exhaustion even as BBP readings indicate buyers remain dominant in the market. The upward gap from the previous close at $187.66 to today's open at $192.41 underpins strong intraday demand and elevated price volatility.
Further gains likely as weekly indicators remain firmly bullish
For the next five trading days, typical volatility places QCOM's expected price range between $188.00 and $198.00. The probability of further price appreciation remains very high, given that all critical weekly trend signals, including RSI-W1, MA-50-W1, ADX-W1, and MACD-W1, remain bullish. The most likely scenario is a consolidation near current levels, while a break above $196.00 could open the way to additional gains. A reversal remains unlikely unless the price closes decisively below immediate support at $155.43.
Previously it was reported that robust quarterly earnings, new AI business wins, and expanded capital returns measures were driving sustained bullish momentum in Qualcomm shares. The current trajectory reinforces this view, with heightened institutional demand and improved supply chain outlook placing the focus on a potential breakout above $196.00 as the next catalyst for further upside.













-
 Afghanistan
-
 Albania
-
 Algeria
-
 Angola
-
 Argentina
-
 Armenia
-
 Australia
-
 Austria
-
 Azerbaijan
-
 Bahamas
-
 Bahrain
-
 Bangladesh
-
 Belarus
-
 Belgium
-
 Bolivia
-
 Botswana
-
 Brazil
-
 Brunei
-
 Bulgaria
-
 Cambodia
-
 Cameroon
-
 Canada
-
 Chile
Chile
-
 China
China
-
 Colombia
-
 Congo
Congo
-
 Costa Rica
-
 Cote d'Ivoire
-
 Croatia
-
 Cuba
Cuba
-
 Cyprus
-
 Czechia
-
 DR Congo
-
 Denmark
-
 Dominican Republic
-
 Ecuador
-
 Egypt
Egypt
-
 El Salvador
-
 Estonia
-
 Eswatini
-
 Ethiopia
-
 Finland
-
 France
-
 Georgia
-
 Germany
-
 Ghana
Ghana
-
 Greece
-
 Haiti
Haiti
-
 Hong Kong
-
 Hungary
-
 India
India
-
 Indonesia
-
 Iran, Islamic republic
-
 Iraq
Iraq
-
 Ireland
-
 Israel
-
 Italy
Italy
-
 Jamaica
-
 Japan
Japan
-
 Jordan
-
 Kazakhstan
-
 Kenya
Kenya
-
 Korea
Korea
-
 Kuwait
-
 Kyrgyzstan
-
 Laos
Laos
-
 Latvia
-
 Lebanon
-
 Lesotho
-
 Libya
Libya
-
 Lithuania
-
 Luxembourg
-
 Madagascar
-
 Malaysia
-
 Malta
Malta
-
 Mauritius
-
 Mexico
-
 Moldova
-
 Mongolia
-
 Montenegro
-
 Morocco
-
 Mozambique
-
 Myanmar
-
 Namibia
-
 Nepal
Nepal
-
 Netherlands
-
 New Zealand
-
 Nigeria
-
 North Macedonia
-
 Norway
-
 Oman
Oman
-
 Pakistan
-
 Palestine
-
 Panama
-
 Papua New Guinea
-
 Paraguay
-
 Peru
Peru
-
 Philippines
-
 Poland
-
 Portugal
-
 Puerto Rico
-
 Qatar
Qatar
-
 Reunion
-
 Romania
-
 Rwanda
-
 Saudi Arabia
-
 Serbia
-
 Singapore
-
 Slovakia
-
 Slovenia
-
 Somalia
-
 South Africa
-
 Spain
Spain
-
 Sri Lanka
-
 Sweden
-
 Switzerland
-
 Syria
Syria
-
 Taiwan
-
 Tajikistan
-
 Tanzania
-
 Thailand
-
 Trinidad and Tobago
-
 Tunisia
-
 Turkey
-
 UAE
UAE
-
 Uganda
-
 Ukraine
-
 United Kingdom
-
United States
-
 Uruguay
-
 Uzbekistan
-
 Venezuela
-
 Vietnam
-
 Yemen
Yemen
-
 Zambia
-
 Zimbabwe
- Forex
- Crypto











