
Bit Digital stock price forecast: $1.74 support in focus as BTBT drops 12.09%

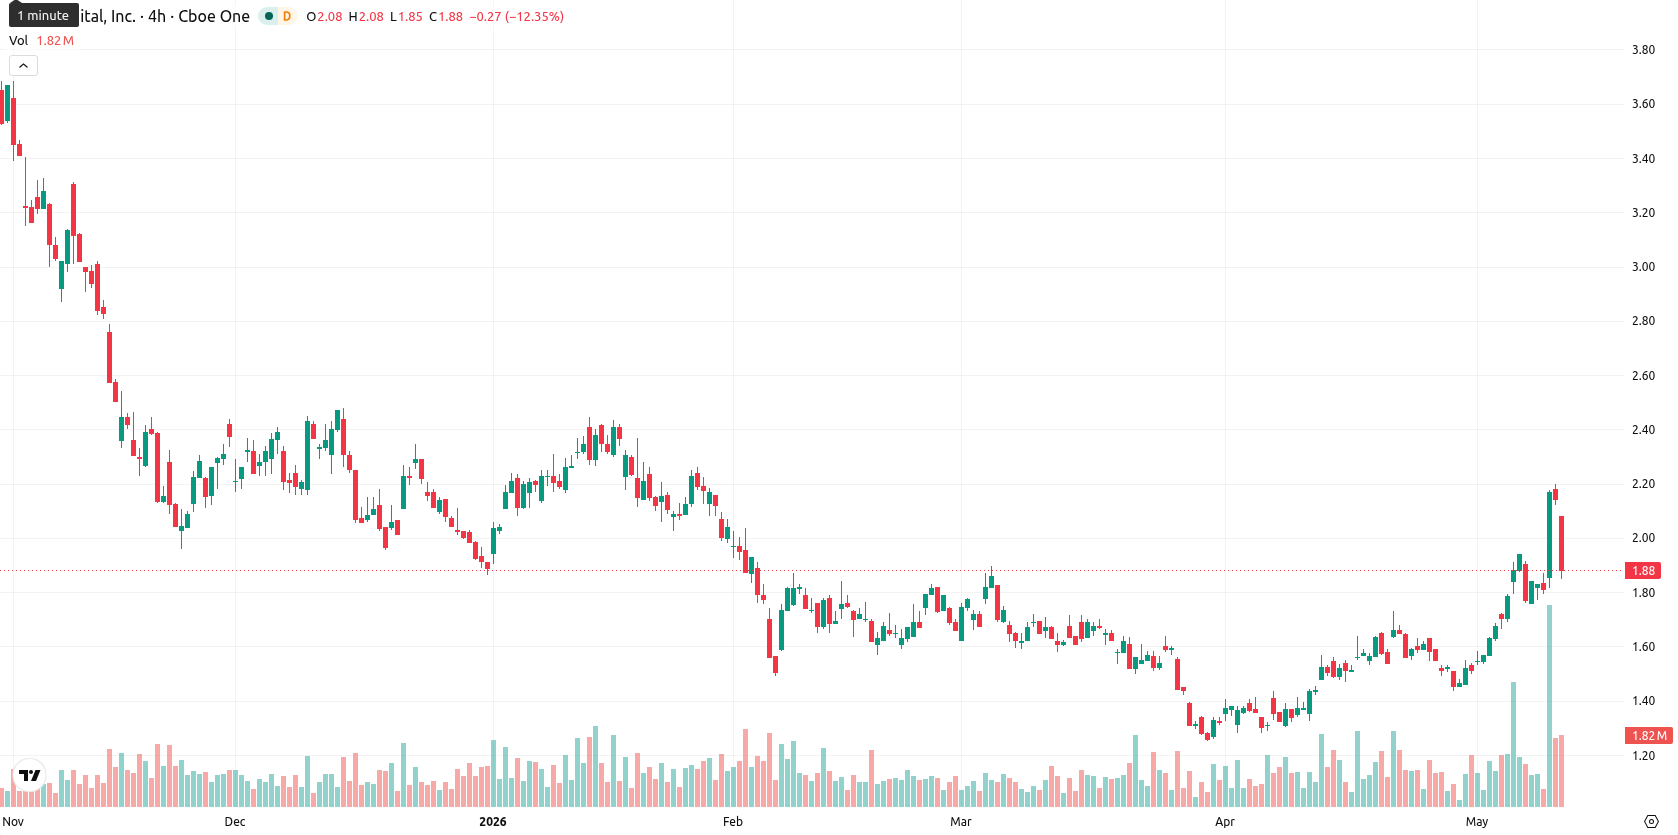
Bit Digital Inc. (BTBT) is trading at $1.89, down 12.09% on the day and positioned above its key short- and medium-term moving averages while remaining below longer-term trend resistance.
Highlights
- Bit Digital will release Q1 2026 results on May 14, following a recent appointment of a new investor relations head, signaling an evolving communications strategy.
- Previous disclosures show $113.6 million revenue, a net loss of $188.4 million, and strong liquidity with a current ratio near 6.4 under continued price pressure.
- Technical signals indicate short-term bullish momentum but with overbought conditions and persistent downside risk, expecting consolidation between $1.80 and $2.10 with low breakout probability.
Investor communication overhaul as quarterly results approach
Bit Digital has scheduled the release of its Q1 2026 financial results for May 14, 2026, with a management webcast and conference call set to accompany the disclosure. The firm recently appointed a new head of investor relations ahead of this event, an action that may signal a revised approach to stakeholder communication. Prior disclosures reported revenue of approximately $113.6 million, a net loss of $188.4 million, and a cash balance of $118.4 million, positioning the company with a current ratio of around 6.4 — though price action has remained under broader selling pressure.
Overbought oscillators contrast with mixed momentum and volatile session
The SMA-20 and SMA-50 are currently at $1.65 and $1.58, respectively, while the SMA-200 stands higher at $2.39. Immediate technical support is identified at the Ichimoku Kijun level of $1.74. Momentum signals are mixed: the D1 MACD shows a buy signal, but the ADX remains low and neutral, indicating trend weakness. Oscillators flag overbought conditions, with the RSI at 71.42, CCI at 235.14, and Stoch RSI at 100, suggesting an overheated market. BBP at 0.45 confirms strong buyer activity intraday, and the Awesome Oscillator supports the upward bias. However, the session featured a gap down at the open ($2.07 vs. $2.15), and price is now near the session low of $1.85, highlighting volatility and pressure after the open. Divergence between overbought signals and bullish momentum, contrasted with intraday weakness, points to potential reversal risk.
Sideways trading likely amid low upside probability and breakout triggers
For the next five sessions, the expected volatility band relative to current levels is $1.80 to $2.10. The probability of a price increase is estimated at less than 20%, making continued downside more likely. The baseline expectation is for sideways consolidation between $1.80 and $2.10. A breakout above $2.10 would open the way for a move toward the SMA-200, while a break below $1.80 could trigger accelerated selling toward support near $1.70.
Earlier, analysts noted that Bit Digital exhibited near-term momentum but faced heightened risks of consolidation amid broader volatility. The latest technical and fundamental developments reinforce the cautious stance and highlight $2.10 as the key resistance level for any potential upside reversal in the days ahead.


Latest Bit Digital News


-
 Afghanistan
-
 Albania
-
 Algeria
-
 Angola
-
 Argentina
-
 Armenia
-
 Australia
-
 Austria
-
 Azerbaijan
-
 Bahamas
-
 Bahrain
-
 Bangladesh
-
 Belarus
-
 Belgium
-
 Bolivia
-
 Botswana
-
 Brazil
-
 Brunei
-
 Bulgaria
-
 Cambodia
-
 Cameroon
-
 Canada
-
 Chile
Chile
-
 China
China
-
 Colombia
-
 Congo
Congo
-
 Costa Rica
-
 Cote d'Ivoire
-
 Croatia
-
 Cuba
Cuba
-
 Cyprus
-
 Czechia
-
 DR Congo
-
 Denmark
-
 Dominican Republic
-
 Ecuador
-
 Egypt
Egypt
-
 El Salvador
-
 Estonia
-
 Eswatini
-
 Ethiopia
-
 Finland
-
 France
-
 Georgia
-
 Germany
-
 Ghana
Ghana
-
 Greece
-
 Haiti
Haiti
-
 Hong Kong
-
 Hungary
-
 India
India
-
 Indonesia
-
 Iran, Islamic republic
-
 Iraq
Iraq
-
 Ireland
-
 Israel
-
 Italy
Italy
-
 Jamaica
-
 Japan
Japan
-
 Jordan
-
 Kazakhstan
-
 Kenya
Kenya
-
 Korea
Korea
-
 Kuwait
-
 Kyrgyzstan
-
 Laos
Laos
-
 Latvia
-
 Lebanon
-
 Lesotho
-
 Libya
Libya
-
 Lithuania
-
 Luxembourg
-
 Madagascar
-
 Malaysia
-
 Malta
Malta
-
 Mauritius
-
 Mexico
-
 Moldova
-
 Mongolia
-
 Montenegro
-
 Morocco
-
 Mozambique
-
 Myanmar
-
 Namibia
-
 Nepal
Nepal
-
 Netherlands
-
 New Zealand
-
 Nigeria
-
 North Macedonia
-
 Norway
-
 Oman
Oman
-
 Pakistan
-
 Palestine
-
 Panama
-
 Papua New Guinea
-
 Paraguay
-
 Peru
Peru
-
 Philippines
-
 Poland
-
 Portugal
-
 Puerto Rico
-
 Qatar
Qatar
-
 Reunion
-
 Romania
-
 Rwanda
-
 Saudi Arabia
-
 Serbia
-
 Singapore
-
 Slovakia
-
 Slovenia
-
 Somalia
-
 South Africa
-
 Spain
Spain
-
 Sri Lanka
-
 Sweden
-
 Switzerland
-
 Syria
Syria
-
 Taiwan
-
 Tajikistan
-
 Tanzania
-
 Thailand
-
 Trinidad and Tobago
-
 Tunisia
-
 Turkey
-
 UAE
UAE
-
 Uganda
-
 Ukraine
-
 United Kingdom
-
United States
-
 Uruguay
-
 Uzbekistan
-
 Venezuela
-
 Vietnam
-
 Yemen
Yemen
-
 Zambia
-
 Zimbabwe
- Forex
- Crypto
