
-8.31% for Bit Digital stock as sellers dominate after weak session open

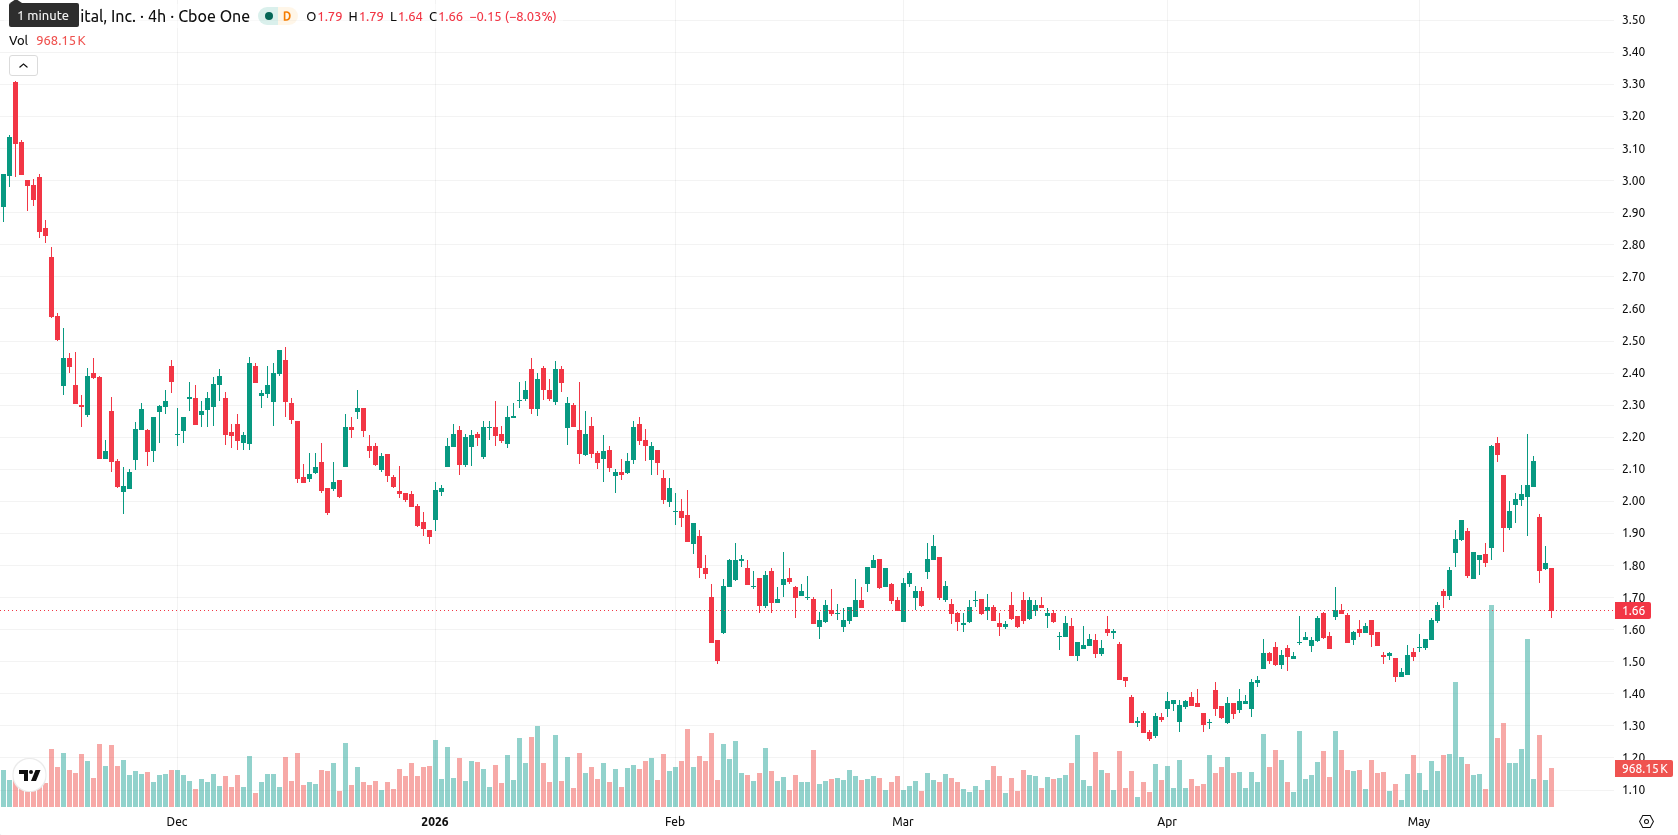
Bit Digital Inc (BTBT) is trading at $1.66, down 8.31% on the day. The price sits below its key moving averages, indicating current headwinds relative to recent trends.
Highlights
- BTBT remains under short-term selling pressure and trades below key long-term moving averages, indicating a prevailing bearish trend.
- Technical indicators show a mixed picture with ongoing bullish momentum signals, yet most trend and oscillator readings lean bearish or neutral.
- Price is expected to consolidate between $1.60 and $1.85 next week, with a breakdown below $1.60 signaling further downside risk.
Mixed signals as intraday sellers outweigh neutral-bullish indicators
Technical analysis for BTBT shows the price is trading below the MA-20 at $1.74 and MA-200 at $2.37, but remains just above the MA-50 at $1.60. The Ichimoku Kijun level on the daily timeframe is $1.77, now serving as immediate resistance near the current price. On the momentum side, the MACD (D1) suggests ongoing bullish momentum, while the ADX (D1) shows a still-developing trend. The RSI (D1) is in a neutral-bullish stance, the Stoch RSI signals strong short-term selling pressure, and BBP (D1) is positive, indicating underlying buyer dominance even as intraday pressure persists. The daily session opened near yesterday’s close, and the last trade occurred near today’s low, underscoring heightened volatility and follow-through selling. The Awesome Oscillator remains neutral, and there is divergence among indicators, with intraday sellers currently dominating price action.
Sideways trade expected as resistance curbs rally potential
In the short term, BTBT is expected to trade within a volatility band of $1.60 to $1.85, reflecting typical volatility around current levels. The probability of a sustained price increase is very low (less than 20%) as most weekly technical indicators remain bearish or neutral. Base case expectation is sideways consolidation between $1.60 and $1.85. A move above $1.77 (Kijun resistance) could trigger upside toward $1.85, while a failure to hold $1.60 would expose the stock to further downside risk and reinforce the broader downtrend.
Earlier, analysts noted that Bit Digital faced ongoing downside risks and a cautious technical outlook amid persistent volatility. The most recent developments reinforce this view, with renewed selling pressure and mixed momentum suggesting that the prevailing trend remains weak and that failure to hold the $1.60 level could intensify downside risk in the near term.


Latest Bit Digital News


-
 Afghanistan
-
 Albania
-
 Algeria
-
 Angola
-
 Argentina
-
 Armenia
-
 Australia
-
 Austria
-
 Azerbaijan
-
 Bahamas
-
 Bahrain
-
 Bangladesh
-
 Belarus
-
 Belgium
-
 Bolivia
-
 Botswana
-
 Brazil
-
 Brunei
-
 Bulgaria
-
 Cambodia
-
 Cameroon
-
 Canada
-
 Chile
Chile
-
 China
China
-
 Colombia
-
 Congo
Congo
-
 Costa Rica
-
 Cote d'Ivoire
-
 Croatia
-
 Cuba
Cuba
-
 Cyprus
-
 Czechia
-
 DR Congo
-
 Denmark
-
 Dominican Republic
-
 Ecuador
-
 Egypt
Egypt
-
 El Salvador
-
 Estonia
-
 Eswatini
-
 Ethiopia
-
 Finland
-
 France
-
 Georgia
-
 Germany
-
 Ghana
Ghana
-
 Greece
-
 Haiti
Haiti
-
 Hong Kong
-
 Hungary
-
 India
India
-
 Indonesia
-
 Iran, Islamic republic
-
 Iraq
Iraq
-
 Ireland
-
 Israel
-
 Italy
Italy
-
 Jamaica
-
 Japan
Japan
-
 Jordan
-
 Kazakhstan
-
 Kenya
Kenya
-
 Korea
Korea
-
 Kuwait
-
 Kyrgyzstan
-
 Laos
Laos
-
 Latvia
-
 Lebanon
-
 Lesotho
-
 Libya
Libya
-
 Lithuania
-
 Luxembourg
-
 Madagascar
-
 Malaysia
-
 Malta
Malta
-
 Mauritius
-
 Mexico
-
 Moldova
-
 Mongolia
-
 Montenegro
-
 Morocco
-
 Mozambique
-
 Myanmar
-
 Namibia
-
 Nepal
Nepal
-
 Netherlands
-
 New Zealand
-
 Nigeria
-
 North Macedonia
-
 Norway
-
 Oman
Oman
-
 Pakistan
-
 Palestine
-
 Panama
-
 Papua New Guinea
-
 Paraguay
-
 Peru
Peru
-
 Philippines
-
 Poland
-
 Portugal
-
 Puerto Rico
-
 Qatar
Qatar
-
 Reunion
-
 Romania
-
 Rwanda
-
 Saudi Arabia
-
 Serbia
-
 Singapore
-
 Slovakia
-
 Slovenia
-
 Somalia
-
 South Africa
-
 Spain
Spain
-
 Sri Lanka
-
 Sweden
-
 Switzerland
-
 Syria
Syria
-
 Taiwan
-
 Tajikistan
-
 Tanzania
-
 Thailand
-
 Trinidad and Tobago
-
 Tunisia
-
 Turkey
-
 UAE
UAE
-
 Uganda
-
 Ukraine
-
 United Kingdom
-
United States
-
 Uruguay
-
 Uzbekistan
-
 Venezuela
-
 Vietnam
-
 Yemen
Yemen
-
 Zambia
-
 Zimbabwe
- Forex
- Crypto
